29
/
en
AIzaSyAYiBZKx7MnpbEhh9jyipgxe19OcubqV5w
April 1, 2024
31276
Europe & Central Asia (excluding high income)
ECA
false
2
1
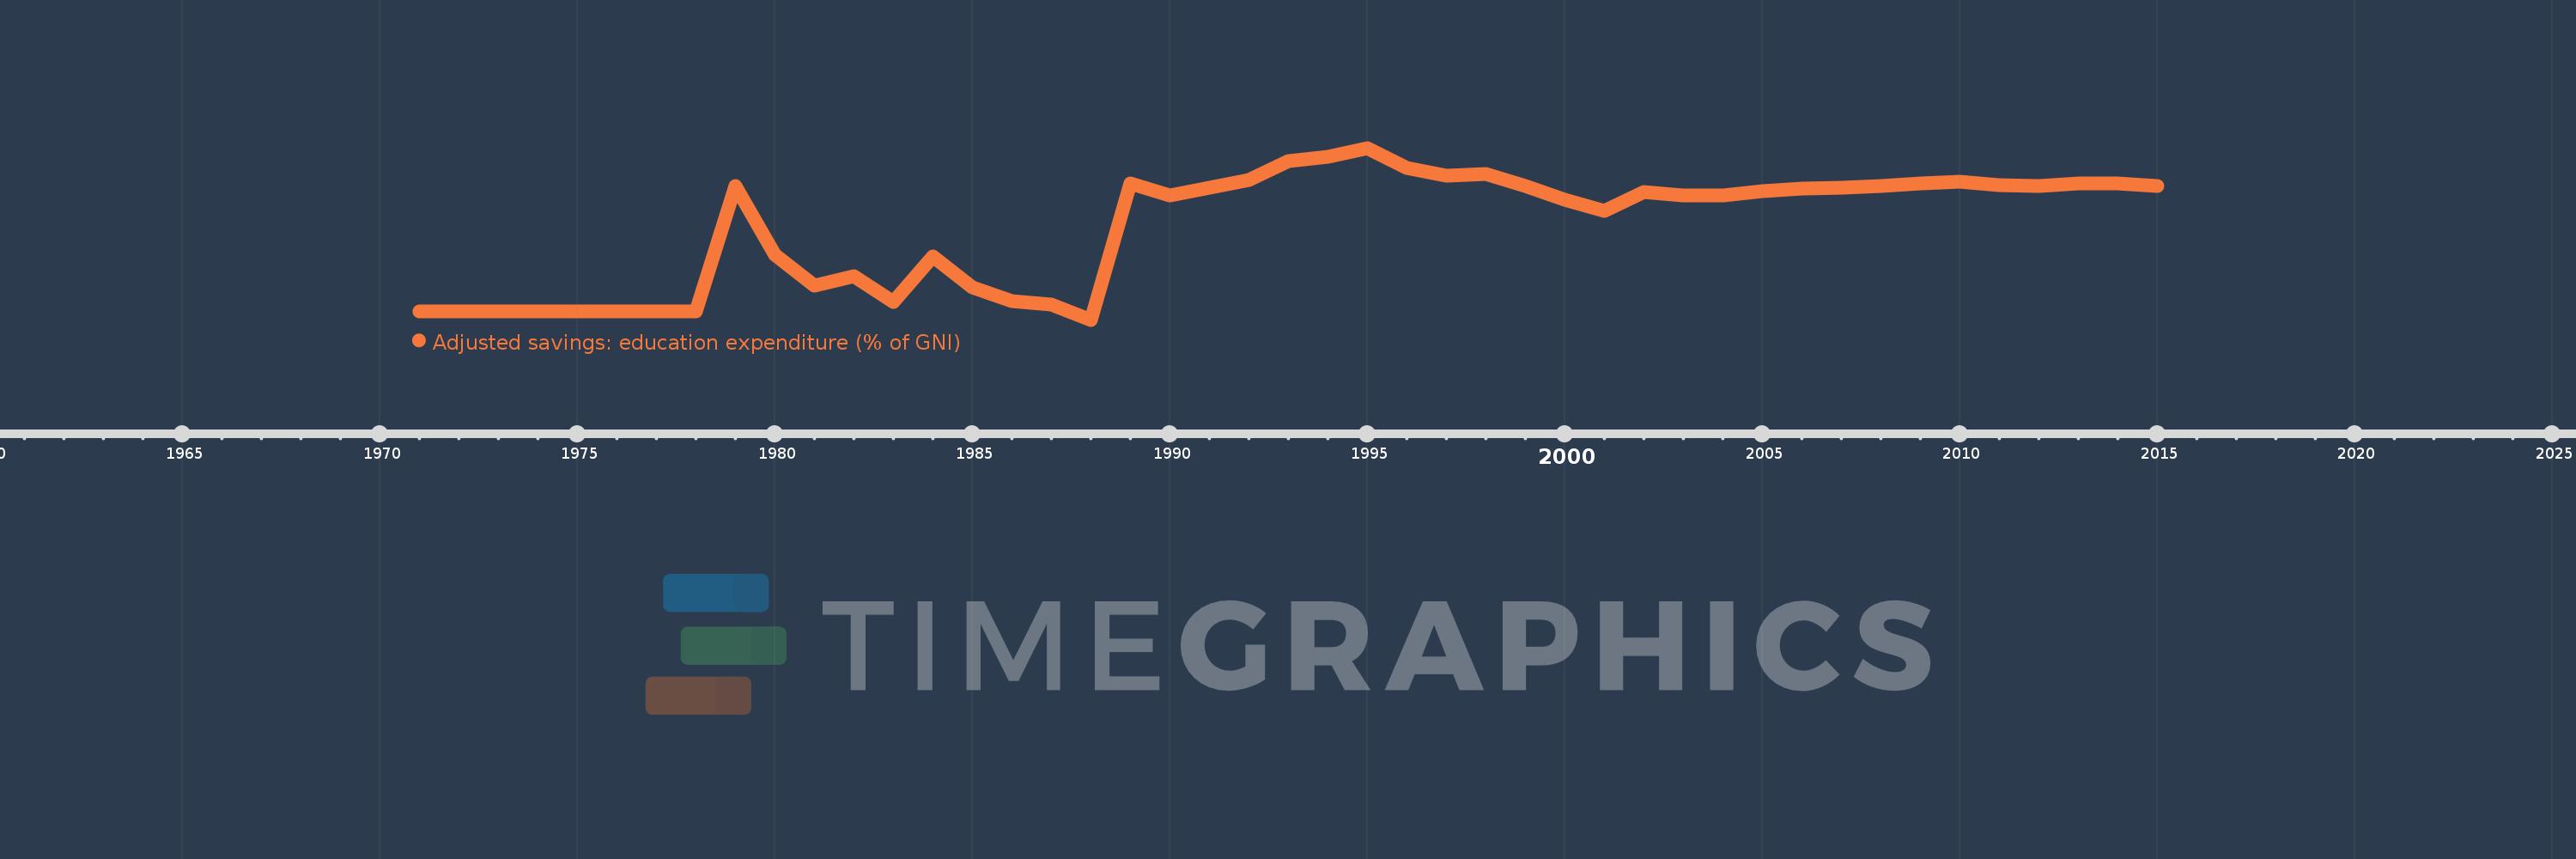
Adjusted savings: education expenditure (% of GNI)
2015,2014,2013,2012,2011,2010,2009,2008,2007,2006,2005,2004,2003,2002,2001,2000,1999,1998,1997,1996,1995,1994,1993,1992,1991,1990,1989,1988,1987,1986,1985,1984,1983,1982,1981,1980,1979,1978,1977,1976,1975,1974,1973,1972,1971
This statistics in other country:
AfghanistanAlbaniaAlgeriaAmerican SamoaAndorraAngolaAntigua and BarbudaArab WorldArgentinaArmeniaAustraliaAustriaAzerbaijanBahamas, TheBahrainBangladeshBarbadosBelarusBelgiumBelizeBeninBermudaBhutanBoliviaBotswanaBrazilBrunei DarussalamBulgariaBurkina FasoBurundiCabo VerdeCambodiaCameroonCanadaCaribbean small statesCentral African RepublicCentral Europe and the BalticsChadChileChinaColombiaComorosCongo, Dem. Rep.Congo, Rep.Costa RicaCote d'IvoireCroatiaCubaCyprusCzech RepublicDenmarkDjiboutiDominicaDominican RepublicEarly-demographic dividendEast Asia & PacificEast Asia & Pacific (excluding high income)East Asia & Pacific (IDA & IBRD countries)EcuadorEgypt, Arab Rep.El SalvadorEquatorial GuineaEritreaEstoniaEthiopiaEuro areaEurope & Central AsiaEurope & Central Asia (excluding high income)Europe & Central Asia (IDA & IBRD countries)European UnionFijiFinlandFragile and conflict affected situationsFranceFrench PolynesiaGabonGambia, TheGeorgiaGermanyGhanaGreeceGrenadaGuatemalaGuineaGuinea-BissauGuyanaHaitiHeavily indebted poor countries (HIPC)High incomeHondurasHong Kong SAR, ChinaHungaryIBRD onlyIcelandIDA & IBRD totalIDA blendIDA onlyIDA totalIndiaIndonesiaIran, Islamic Rep.IraqIrelandIsraelItalyJamaicaJapanJordanKazakhstanKenyaKiribatiKorea, Rep.KuwaitKyrgyz RepublicLao PDRLate-demographic dividendLatin America & Caribbean Latin America & Caribbean (excluding high income)Latin America & the Caribbean (IDA & IBRD countries)LatviaLeast developed countries: UN classificationLebanonLesothoLiberiaLibyaLiechtensteinLithuaniaLow & middle incomeLow incomeLower middle incomeLuxembourgMacao SAR, ChinaMacedonia, FYRMadagascarMalawiMalaysiaMaldivesMaliMaltaMarshall IslandsMauritaniaMauritiusMexicoMicronesia, Fed. Sts.Middle East & North AfricaMiddle East & North Africa (excluding high income)Middle East & North Africa (IDA & IBRD countries)Middle incomeMoldovaMonacoMongoliaMoroccoMozambiqueMyanmarNamibiaNepalNetherlandsNew CaledoniaNew ZealandNicaraguaNigerNigeriaNorth AmericaNorwayOECD membersOmanOther small statesPacific island small statesPakistanPanamaPapua New GuineaParaguayPeruPhilippinesPolandPortugalPost-demographic dividendPre-demographic dividendPuerto RicoQatarRomaniaRussian FederationRwandaSamoaSan MarinoSao Tome and PrincipeSaudi ArabiaSenegalSerbiaSeychellesSierra LeoneSingaporeSlovak RepublicSloveniaSmall statesSolomon IslandsSomaliaSouth AfricaSouth AsiaSouth Asia (IDA & IBRD)SpainSri LankaSt. Kitts and NevisSt. LuciaSt. Vincent and the GrenadinesSub-Saharan Africa Sub-Saharan Africa (excluding high income)Sub-Saharan Africa (IDA & IBRD countries)SudanSurinameSwazilandSwedenSwitzerlandSyrian Arab RepublicTajikistanTanzaniaThailandTimor-LesteTogoTongaTrinidad and TobagoTunisiaTurkeyTurkmenistanUgandaUkraineUnited KingdomUnited StatesUpper middle incomeUruguayUzbekistanVanuatuVenezuela, RBVietnamVirgin Islands (U.S.)WorldYemen, Rep.ZambiaZimbabwe Timeline:
This timeline shows a graph from 1971 to 2015 of Europe & Central Asia (excluding high income). No data until 1970. Number of actual observations by date: 45.
Source name:
World Development Indicators
Source organization:
World Bank staff estimates using data from the United Nations Statistics Division's Statistical Yearbook, and the UNESCO Institute for Statistics online database.
Categories, topics:
Economy & Growth, Environment
Last updated:
apr 23, 2017
Indicators value changes by year
At the date of observation
Value
Absolute change
Change from previous value
jan 1, 1971
1.859
+1.859
0.0%
jan 1, 1972
1.859
0.0
0.0%
jan 1, 1973
1.859
0.0
0.0%
jan 1, 1974
1.859
0.0
0.0%
jan 1, 1975
1.859
0.0
0.0%
jan 1, 1976
1.859
0.0
0.0%
jan 1, 1977
1.859
0.0
0.0%
jan 1, 1978
1.859
0.0
0.0%
jan 1, 1979
3.5
+1.641
88.26%
jan 1, 1980
2.6
-0.9
-25.71%
jan 1, 1981
2.204
-0.396
-15.22%
jan 1, 1982
2.319
+0.114
5.19%
jan 1, 1983
1.99
-0.329
-14.19%
jan 1, 1984
2.579
+0.59
29.63%
jan 1, 1985
2.178
-0.402
-15.58%
jan 1, 1986
1.994
-0.183
-8.42%
jan 1, 1987
1.954
-0.04
-2.03%
jan 1, 1988
1.755
-0.198
-10.16%
jan 1, 1989
3.528
+1.773
101.03%
jan 1, 1990
3.374
-0.155
-4.38%
jan 1, 1991
3.481
+0.107
3.18%
jan 1, 1992
3.575
+0.094
2.69%
jan 1, 1993
3.825
+0.25
6.99%
jan 1, 1994
3.881
+0.056
1.47%
jan 1, 1995
3.995
+0.114
2.93%
jan 1, 1996
3.731
-0.264
-6.6%
jan 1, 1997
3.633
-0.098
-2.62%
jan 1, 1998
3.651
+0.018
0.5%
jan 1, 1999
3.502
-0.149
-4.09%
jan 1, 2000
3.315
-0.188
-5.35%
jan 1, 2001
3.172
-0.143
-4.31%
jan 1, 2002
3.417
+0.246
7.75%
jan 1, 2003
3.372
-0.046
-1.34%
jan 1, 2004
3.374
+0.002
0.06%
jan 1, 2005
3.429
+0.056
1.65%
jan 1, 2006
3.462
+0.033
0.96%
jan 1, 2007
3.482
+0.02
0.57%
jan 1, 2008
3.494
+0.012
0.35%
jan 1, 2009
3.528
+0.033
0.96%
jan 1, 2010
3.555
+0.027
0.78%
jan 1, 2011
3.505
-0.051
-1.42%
jan 1, 2012
3.494
-0.01
-0.29%
jan 1, 2013
3.53
+0.036
1.03%
jan 1, 2014
3.533
+0.002
0.06%
jan 1, 2015
3.498
-0.035
-0.98%
Ranking of countries by current statistics by years


Comments: