29
/
en
AIzaSyAYiBZKx7MnpbEhh9jyipgxe19OcubqV5w
April 1, 2024
37120
IDA & IBRD total
IBT
false
2
1
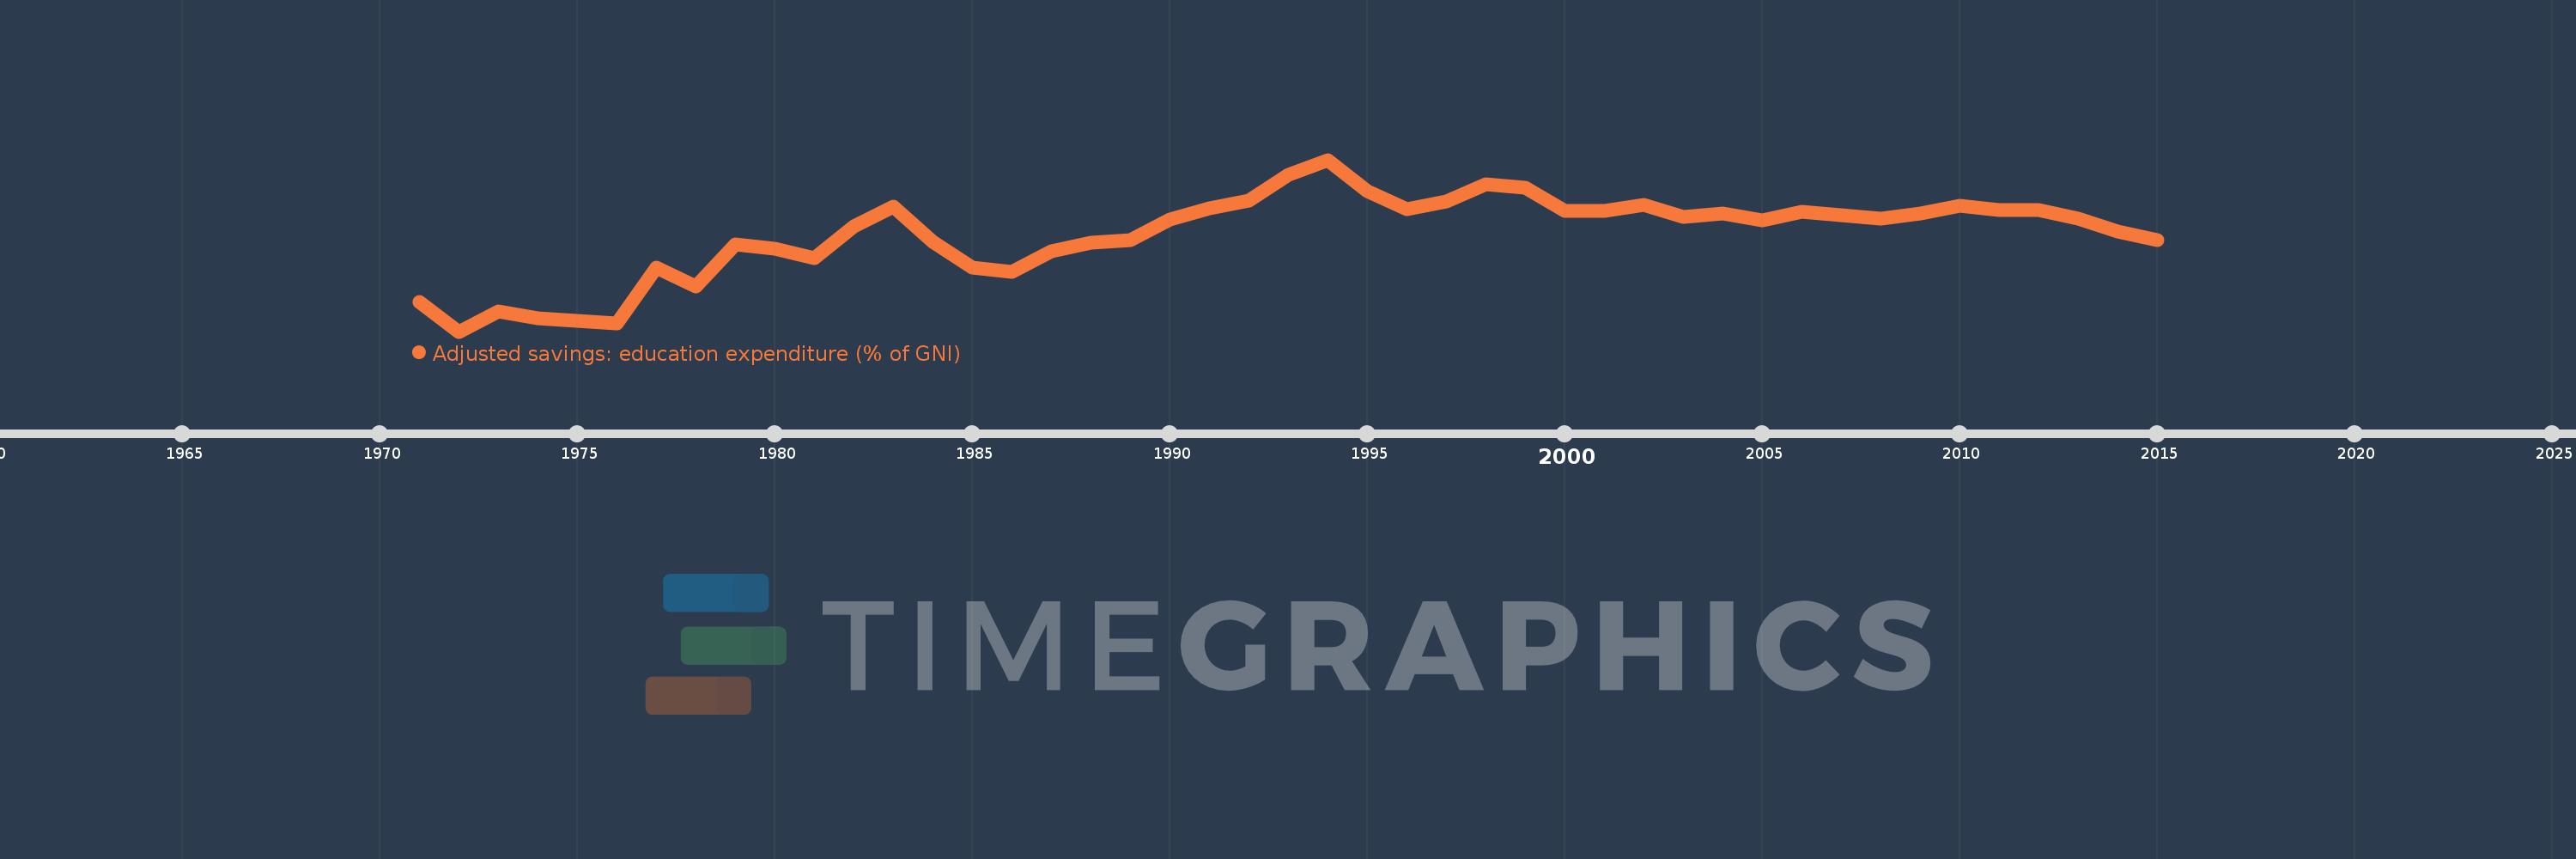
Adjusted savings: education expenditure (% of GNI)
2015,2014,2013,2012,2011,2010,2009,2008,2007,2006,2005,2004,2003,2002,2001,2000,1999,1998,1997,1996,1995,1994,1993,1992,1991,1990,1989,1988,1987,1986,1985,1984,1983,1982,1981,1980,1979,1978,1977,1976,1975,1974,1973,1972,1971
This statistics in other country:
AfghanistanAlbaniaAlgeriaAmerican SamoaAndorraAngolaAntigua and BarbudaArab WorldArgentinaArmeniaAustraliaAustriaAzerbaijanBahamas, TheBahrainBangladeshBarbadosBelarusBelgiumBelizeBeninBermudaBhutanBoliviaBotswanaBrazilBrunei DarussalamBulgariaBurkina FasoBurundiCabo VerdeCambodiaCameroonCanadaCaribbean small statesCentral African RepublicCentral Europe and the BalticsChadChileChinaColombiaComorosCongo, Dem. Rep.Congo, Rep.Costa RicaCote d'IvoireCroatiaCubaCyprusCzech RepublicDenmarkDjiboutiDominicaDominican RepublicEarly-demographic dividendEast Asia & PacificEast Asia & Pacific (excluding high income)East Asia & Pacific (IDA & IBRD countries)EcuadorEgypt, Arab Rep.El SalvadorEquatorial GuineaEritreaEstoniaEthiopiaEuro areaEurope & Central AsiaEurope & Central Asia (excluding high income)Europe & Central Asia (IDA & IBRD countries)European UnionFijiFinlandFragile and conflict affected situationsFranceFrench PolynesiaGabonGambia, TheGeorgiaGermanyGhanaGreeceGrenadaGuatemalaGuineaGuinea-BissauGuyanaHaitiHeavily indebted poor countries (HIPC)High incomeHondurasHong Kong SAR, ChinaHungaryIBRD onlyIcelandIDA & IBRD totalIDA blendIDA onlyIDA totalIndiaIndonesiaIran, Islamic Rep.IraqIrelandIsraelItalyJamaicaJapanJordanKazakhstanKenyaKiribatiKorea, Rep.KuwaitKyrgyz RepublicLao PDRLate-demographic dividendLatin America & Caribbean Latin America & Caribbean (excluding high income)Latin America & the Caribbean (IDA & IBRD countries)LatviaLeast developed countries: UN classificationLebanonLesothoLiberiaLibyaLiechtensteinLithuaniaLow & middle incomeLow incomeLower middle incomeLuxembourgMacao SAR, ChinaMacedonia, FYRMadagascarMalawiMalaysiaMaldivesMaliMaltaMarshall IslandsMauritaniaMauritiusMexicoMicronesia, Fed. Sts.Middle East & North AfricaMiddle East & North Africa (excluding high income)Middle East & North Africa (IDA & IBRD countries)Middle incomeMoldovaMonacoMongoliaMoroccoMozambiqueMyanmarNamibiaNepalNetherlandsNew CaledoniaNew ZealandNicaraguaNigerNigeriaNorth AmericaNorwayOECD membersOmanOther small statesPacific island small statesPakistanPanamaPapua New GuineaParaguayPeruPhilippinesPolandPortugalPost-demographic dividendPre-demographic dividendPuerto RicoQatarRomaniaRussian FederationRwandaSamoaSan MarinoSao Tome and PrincipeSaudi ArabiaSenegalSerbiaSeychellesSierra LeoneSingaporeSlovak RepublicSloveniaSmall statesSolomon IslandsSomaliaSouth AfricaSouth AsiaSouth Asia (IDA & IBRD)SpainSri LankaSt. Kitts and NevisSt. LuciaSt. Vincent and the GrenadinesSub-Saharan Africa Sub-Saharan Africa (excluding high income)Sub-Saharan Africa (IDA & IBRD countries)SudanSurinameSwazilandSwedenSwitzerlandSyrian Arab RepublicTajikistanTanzaniaThailandTimor-LesteTogoTongaTrinidad and TobagoTunisiaTurkeyTurkmenistanUgandaUkraineUnited KingdomUnited StatesUpper middle incomeUruguayUzbekistanVanuatuVenezuela, RBVietnamVirgin Islands (U.S.)WorldYemen, Rep.ZambiaZimbabwe Timeline:
This timeline shows a graph from 1971 to 2015 of IDA & IBRD total. No data until 1970. Number of actual observations by date: 45.
Source name:
World Development Indicators
Source organization:
World Bank staff estimates using data from the United Nations Statistics Division's Statistical Yearbook, and the UNESCO Institute for Statistics online database.
Categories, topics:
Economy & Growth, Environment
Last updated:
apr 23, 2017
Indicators value changes by year
At the date of observation
Value
Absolute change
Change from previous value
jan 1, 1971
2.691
+2.691
0.0%
jan 1, 1972
2.481
-0.21
-7.79%
jan 1, 1973
2.623
+0.142
5.7%
jan 1, 1974
2.576
-0.047
-1.78%
jan 1, 1975
2.559
-0.017
-0.67%
jan 1, 1976
2.54
-0.019
-0.72%
jan 1, 1977
2.94
+0.4
15.74%
jan 1, 1978
2.805
-0.135
-4.6%
jan 1, 1979
3.102
+0.297
10.58%
jan 1, 1980
3.076
-0.025
-0.81%
jan 1, 1981
3.003
-0.074
-2.4%
jan 1, 1982
3.235
+0.233
7.75%
jan 1, 1983
3.375
+0.14
4.31%
jan 1, 1984
3.125
-0.25
-7.4%
jan 1, 1985
2.941
-0.184
-5.9%
jan 1, 1986
2.91
-0.031
-1.05%
jan 1, 1987
3.057
+0.147
5.04%
jan 1, 1988
3.118
+0.061
2.0%
jan 1, 1989
3.137
+0.019
0.62%
jan 1, 1990
3.279
+0.142
4.53%
jan 1, 1991
3.36
+0.081
2.47%
jan 1, 1992
3.419
+0.059
1.75%
jan 1, 1993
3.601
+0.182
5.32%
jan 1, 1994
3.708
+0.108
2.99%
jan 1, 1995
3.483
-0.226
-6.08%
jan 1, 1996
3.358
-0.125
-3.59%
jan 1, 1997
3.409
+0.051
1.52%
jan 1, 1998
3.533
+0.125
3.65%
jan 1, 1999
3.511
-0.022
-0.61%
jan 1, 2000
3.346
-0.165
-4.7%
jan 1, 2001
3.342
-0.005
-0.14%
jan 1, 2002
3.387
+0.045
1.36%
jan 1, 2003
3.297
-0.09
-2.65%
jan 1, 2004
3.323
+0.026
0.78%
jan 1, 2005
3.274
-0.049
-1.47%
jan 1, 2006
3.339
+0.065
1.97%
jan 1, 2007
3.314
-0.024
-0.72%
jan 1, 2008
3.287
-0.028
-0.83%
jan 1, 2009
3.323
+0.036
1.1%
jan 1, 2010
3.377
+0.054
1.63%
jan 1, 2011
3.348
-0.029
-0.86%
jan 1, 2012
3.347
-0.002
-0.04%
jan 1, 2013
3.289
-0.057
-1.71%
jan 1, 2014
3.197
-0.093
-2.82%
jan 1, 2015
3.134
-0.062
-1.95%
Ranking of countries by current statistics by years


Comments: