29
/
en
AIzaSyAYiBZKx7MnpbEhh9jyipgxe19OcubqV5w
April 1, 2024
44022
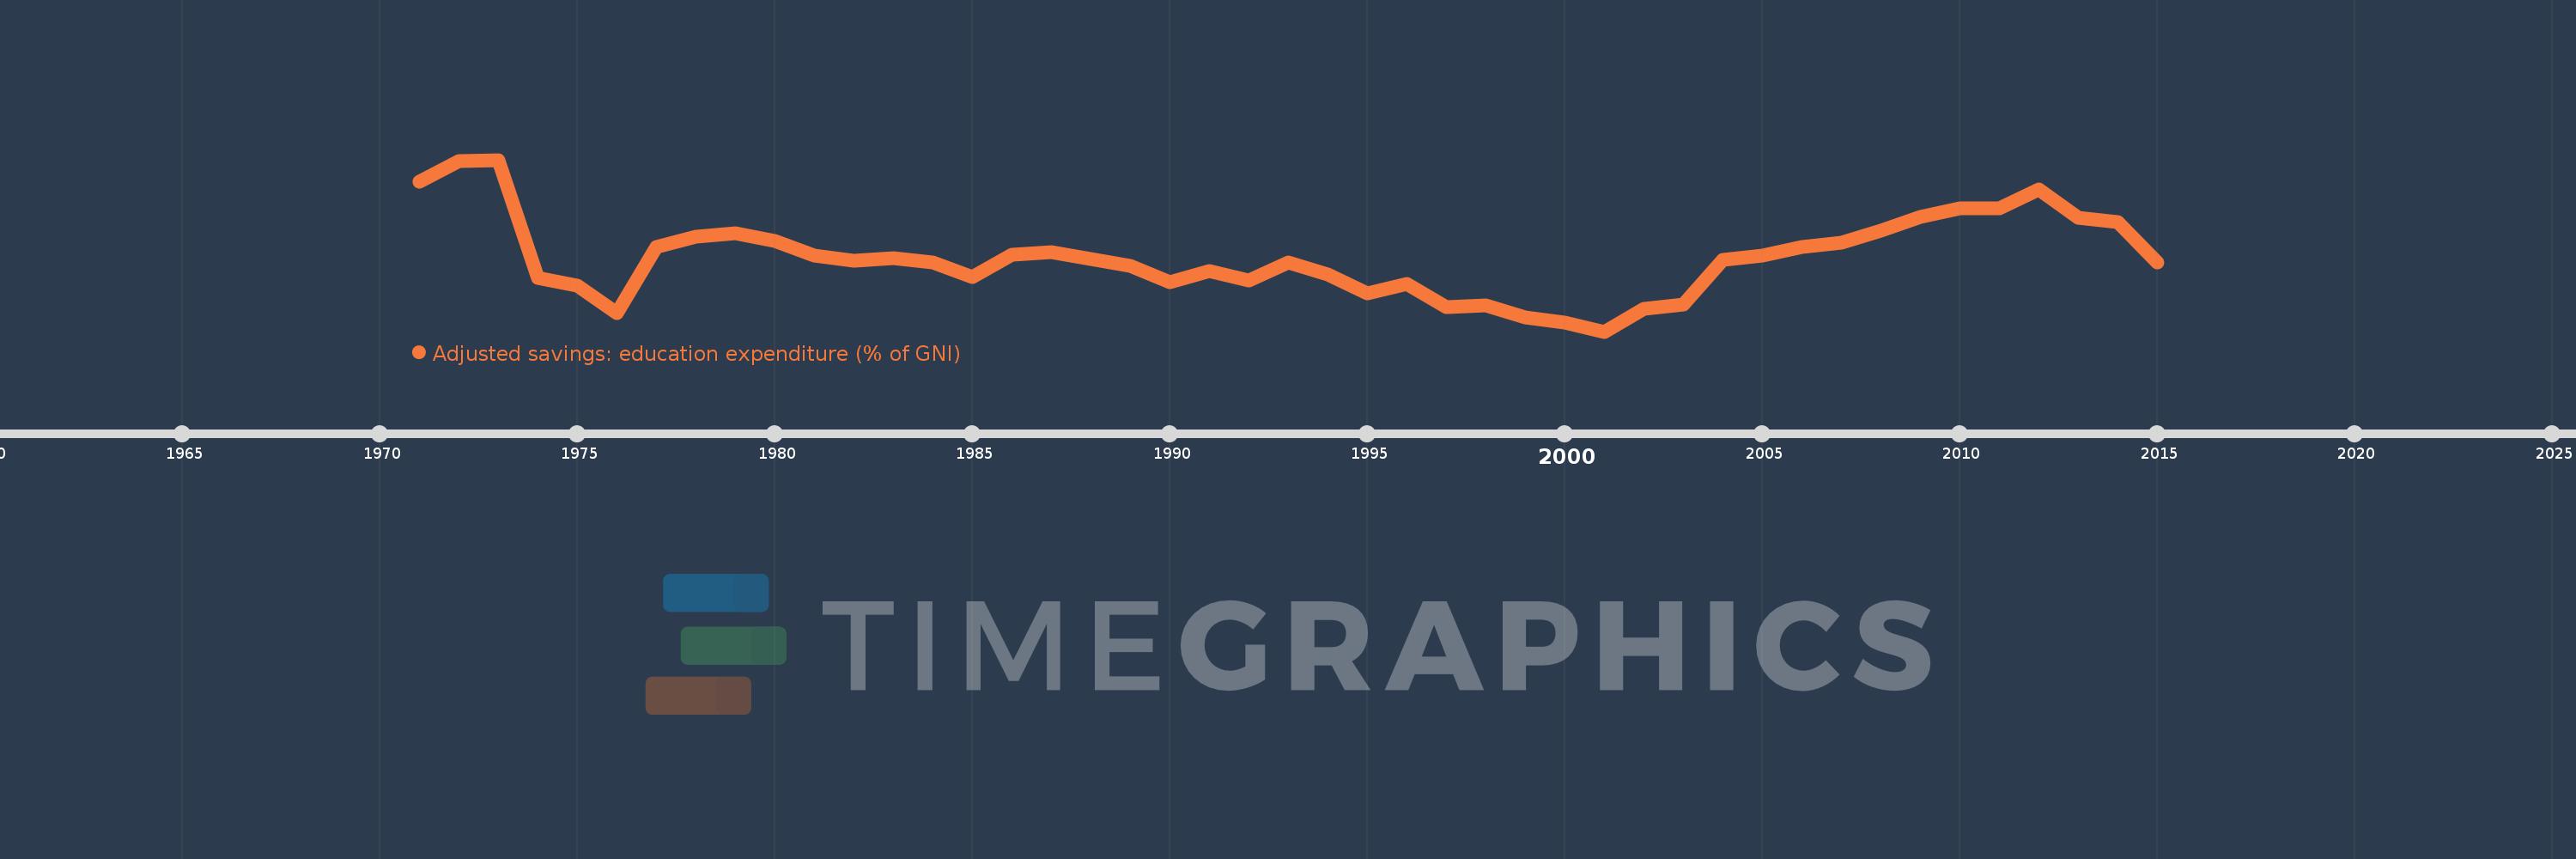
Least developed countries: UN classification
LDC
false
2
1
Adjusted savings: education expenditure (% of GNI)
2015,2014,2013,2012,2011,2010,2009,2008,2007,2006,2005,2004,2003,2002,2001,2000,1999,1998,1997,1996,1995,1994,1993,1992,1991,1990,1989,1988,1987,1986,1985,1984,1983,1982,1981,1980,1979,1978,1977,1976,1975,1974,1973,1972,1971
This statistics in other country:
AfghanistanAlbaniaAlgeriaAmerican SamoaAndorraAngolaAntigua and BarbudaArab WorldArgentinaArmeniaAustraliaAustriaAzerbaijanBahamas, TheBahrainBangladeshBarbadosBelarusBelgiumBelizeBeninBermudaBhutanBoliviaBotswanaBrazilBrunei DarussalamBulgariaBurkina FasoBurundiCabo VerdeCambodiaCameroonCanadaCaribbean small statesCentral African RepublicCentral Europe and the BalticsChadChileChinaColombiaComorosCongo, Dem. Rep.Congo, Rep.Costa RicaCote d'IvoireCroatiaCubaCyprusCzech RepublicDenmarkDjiboutiDominicaDominican RepublicEarly-demographic dividendEast Asia & PacificEast Asia & Pacific (excluding high income)East Asia & Pacific (IDA & IBRD countries)EcuadorEgypt, Arab Rep.El SalvadorEquatorial GuineaEritreaEstoniaEthiopiaEuro areaEurope & Central AsiaEurope & Central Asia (excluding high income)Europe & Central Asia (IDA & IBRD countries)European UnionFijiFinlandFragile and conflict affected situationsFranceFrench PolynesiaGabonGambia, TheGeorgiaGermanyGhanaGreeceGrenadaGuatemalaGuineaGuinea-BissauGuyanaHaitiHeavily indebted poor countries (HIPC)High incomeHondurasHong Kong SAR, ChinaHungaryIBRD onlyIcelandIDA & IBRD totalIDA blendIDA onlyIDA totalIndiaIndonesiaIran, Islamic Rep.IraqIrelandIsraelItalyJamaicaJapanJordanKazakhstanKenyaKiribatiKorea, Rep.KuwaitKyrgyz RepublicLao PDRLate-demographic dividendLatin America & Caribbean Latin America & Caribbean (excluding high income)Latin America & the Caribbean (IDA & IBRD countries)LatviaLeast developed countries: UN classificationLebanonLesothoLiberiaLibyaLiechtensteinLithuaniaLow & middle incomeLow incomeLower middle incomeLuxembourgMacao SAR, ChinaMacedonia, FYRMadagascarMalawiMalaysiaMaldivesMaliMaltaMarshall IslandsMauritaniaMauritiusMexicoMicronesia, Fed. Sts.Middle East & North AfricaMiddle East & North Africa (excluding high income)Middle East & North Africa (IDA & IBRD countries)Middle incomeMoldovaMonacoMongoliaMoroccoMozambiqueMyanmarNamibiaNepalNetherlandsNew CaledoniaNew ZealandNicaraguaNigerNigeriaNorth AmericaNorwayOECD membersOmanOther small statesPacific island small statesPakistanPanamaPapua New GuineaParaguayPeruPhilippinesPolandPortugalPost-demographic dividendPre-demographic dividendPuerto RicoQatarRomaniaRussian FederationRwandaSamoaSan MarinoSao Tome and PrincipeSaudi ArabiaSenegalSerbiaSeychellesSierra LeoneSingaporeSlovak RepublicSloveniaSmall statesSolomon IslandsSomaliaSouth AfricaSouth AsiaSouth Asia (IDA & IBRD)SpainSri LankaSt. Kitts and NevisSt. LuciaSt. Vincent and the GrenadinesSub-Saharan Africa Sub-Saharan Africa (excluding high income)Sub-Saharan Africa (IDA & IBRD countries)SudanSurinameSwazilandSwedenSwitzerlandSyrian Arab RepublicTajikistanTanzaniaThailandTimor-LesteTogoTongaTrinidad and TobagoTunisiaTurkeyTurkmenistanUgandaUkraineUnited KingdomUnited StatesUpper middle incomeUruguayUzbekistanVanuatuVenezuela, RBVietnamVirgin Islands (U.S.)WorldYemen, Rep.ZambiaZimbabwe Timeline:
This timeline shows a graph from 1971 to 2015 of Least developed countries: UN classification. No data until 1970. Number of actual observations by date: 45.
Source name:
World Development Indicators
Source organization:
World Bank staff estimates using data from the United Nations Statistics Division's Statistical Yearbook, and the UNESCO Institute for Statistics online database.
Categories, topics:
Economy & Growth, Environment
Last updated:
apr 23, 2017
Indicators value changes by year
At the date of observation
Value
Absolute change
Change from previous value
jan 1, 1971
2.816
+2.816
0.0%
jan 1, 1972
2.926
+0.11
3.9%
jan 1, 1973
2.932
+0.006
0.2%
jan 1, 1974
2.309
-0.623
-21.24%
jan 1, 1975
2.269
-0.041
-1.76%
jan 1, 1976
2.121
-0.148
-6.51%
jan 1, 1977
2.47
+0.35
16.48%
jan 1, 1978
2.526
+0.056
2.27%
jan 1, 1979
2.542
+0.016
0.62%
jan 1, 1980
2.505
-0.037
-1.44%
jan 1, 1981
2.426
-0.079
-3.17%
jan 1, 1982
2.398
-0.028
-1.17%
jan 1, 1983
2.414
+0.016
0.67%
jan 1, 1984
2.391
-0.023
-0.95%
jan 1, 1985
2.314
-0.077
-3.23%
jan 1, 1986
2.429
+0.115
4.99%
jan 1, 1987
2.444
+0.015
0.64%
jan 1, 1988
2.408
-0.036
-1.49%
jan 1, 1989
2.371
-0.037
-1.54%
jan 1, 1990
2.286
-0.085
-3.58%
jan 1, 1991
2.345
+0.059
2.58%
jan 1, 1992
2.296
-0.049
-2.11%
jan 1, 1993
2.391
+0.096
4.17%
jan 1, 1994
2.327
-0.064
-2.68%
jan 1, 1995
2.224
-0.103
-4.42%
jan 1, 1996
2.278
+0.054
2.41%
jan 1, 1997
2.152
-0.126
-5.51%
jan 1, 1998
2.163
+0.011
0.52%
jan 1, 1999
2.098
-0.065
-3.03%
jan 1, 2000
2.071
-0.027
-1.29%
jan 1, 2001
2.024
-0.047
-2.27%
jan 1, 2002
2.145
+0.121
5.98%
jan 1, 2003
2.167
+0.022
1.02%
jan 1, 2004
2.405
+0.238
10.98%
jan 1, 2005
2.427
+0.022
0.91%
jan 1, 2006
2.472
+0.046
1.89%
jan 1, 2007
2.493
+0.02
0.82%
jan 1, 2008
2.558
+0.065
2.6%
jan 1, 2009
2.628
+0.071
2.77%
jan 1, 2010
2.674
+0.045
1.72%
jan 1, 2011
2.675
+0.001
0.03%
jan 1, 2012
2.775
+0.101
3.76%
jan 1, 2013
2.627
-0.148
-5.35%
jan 1, 2014
2.601
-0.026
-0.98%
jan 1, 2015
2.391
-0.21
-8.06%
Ranking of countries by current statistics by years


Comments: