29
/
en
AIzaSyAYiBZKx7MnpbEhh9jyipgxe19OcubqV5w
April 1, 2024
44788
Low & middle income
LMY
false
2
1
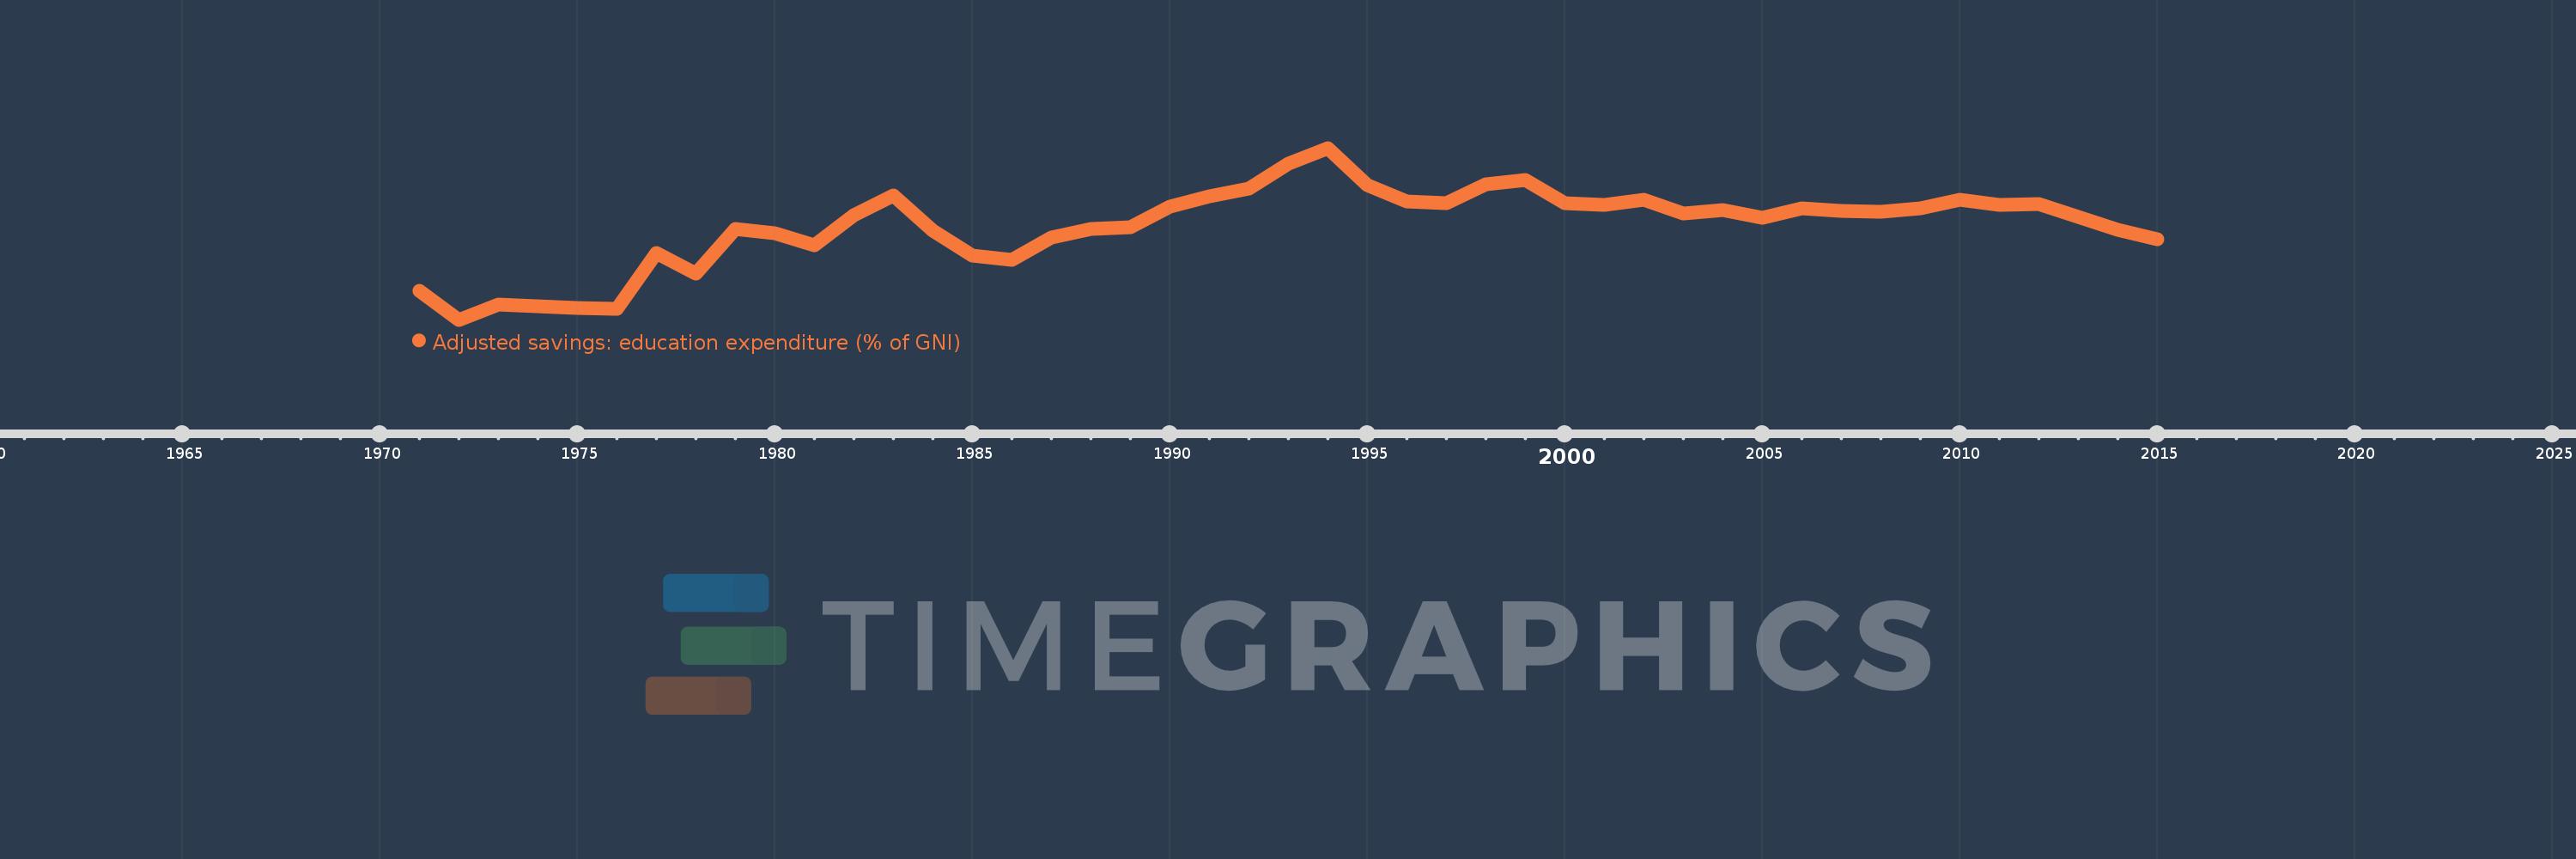
Adjusted savings: education expenditure (% of GNI)
2015,2014,2013,2012,2011,2010,2009,2008,2007,2006,2005,2004,2003,2002,2001,2000,1999,1998,1997,1996,1995,1994,1993,1992,1991,1990,1989,1988,1987,1986,1985,1984,1983,1982,1981,1980,1979,1978,1977,1976,1975,1974,1973,1972,1971
This statistics in other country:
AfghanistanAlbaniaAlgeriaAmerican SamoaAndorraAngolaAntigua and BarbudaArab WorldArgentinaArmeniaAustraliaAustriaAzerbaijanBahamas, TheBahrainBangladeshBarbadosBelarusBelgiumBelizeBeninBermudaBhutanBoliviaBotswanaBrazilBrunei DarussalamBulgariaBurkina FasoBurundiCabo VerdeCambodiaCameroonCanadaCaribbean small statesCentral African RepublicCentral Europe and the BalticsChadChileChinaColombiaComorosCongo, Dem. Rep.Congo, Rep.Costa RicaCote d'IvoireCroatiaCubaCyprusCzech RepublicDenmarkDjiboutiDominicaDominican RepublicEarly-demographic dividendEast Asia & PacificEast Asia & Pacific (excluding high income)East Asia & Pacific (IDA & IBRD countries)EcuadorEgypt, Arab Rep.El SalvadorEquatorial GuineaEritreaEstoniaEthiopiaEuro areaEurope & Central AsiaEurope & Central Asia (excluding high income)Europe & Central Asia (IDA & IBRD countries)European UnionFijiFinlandFragile and conflict affected situationsFranceFrench PolynesiaGabonGambia, TheGeorgiaGermanyGhanaGreeceGrenadaGuatemalaGuineaGuinea-BissauGuyanaHaitiHeavily indebted poor countries (HIPC)High incomeHondurasHong Kong SAR, ChinaHungaryIBRD onlyIcelandIDA & IBRD totalIDA blendIDA onlyIDA totalIndiaIndonesiaIran, Islamic Rep.IraqIrelandIsraelItalyJamaicaJapanJordanKazakhstanKenyaKiribatiKorea, Rep.KuwaitKyrgyz RepublicLao PDRLate-demographic dividendLatin America & Caribbean Latin America & Caribbean (excluding high income)Latin America & the Caribbean (IDA & IBRD countries)LatviaLeast developed countries: UN classificationLebanonLesothoLiberiaLibyaLiechtensteinLithuaniaLow & middle incomeLow incomeLower middle incomeLuxembourgMacao SAR, ChinaMacedonia, FYRMadagascarMalawiMalaysiaMaldivesMaliMaltaMarshall IslandsMauritaniaMauritiusMexicoMicronesia, Fed. Sts.Middle East & North AfricaMiddle East & North Africa (excluding high income)Middle East & North Africa (IDA & IBRD countries)Middle incomeMoldovaMonacoMongoliaMoroccoMozambiqueMyanmarNamibiaNepalNetherlandsNew CaledoniaNew ZealandNicaraguaNigerNigeriaNorth AmericaNorwayOECD membersOmanOther small statesPacific island small statesPakistanPanamaPapua New GuineaParaguayPeruPhilippinesPolandPortugalPost-demographic dividendPre-demographic dividendPuerto RicoQatarRomaniaRussian FederationRwandaSamoaSan MarinoSao Tome and PrincipeSaudi ArabiaSenegalSerbiaSeychellesSierra LeoneSingaporeSlovak RepublicSloveniaSmall statesSolomon IslandsSomaliaSouth AfricaSouth AsiaSouth Asia (IDA & IBRD)SpainSri LankaSt. Kitts and NevisSt. LuciaSt. Vincent and the GrenadinesSub-Saharan Africa Sub-Saharan Africa (excluding high income)Sub-Saharan Africa (IDA & IBRD countries)SudanSurinameSwazilandSwedenSwitzerlandSyrian Arab RepublicTajikistanTanzaniaThailandTimor-LesteTogoTongaTrinidad and TobagoTunisiaTurkeyTurkmenistanUgandaUkraineUnited KingdomUnited StatesUpper middle incomeUruguayUzbekistanVanuatuVenezuela, RBVietnamVirgin Islands (U.S.)WorldYemen, Rep.ZambiaZimbabwe Timeline:
This timeline shows a graph from 1971 to 2015 of Low & middle income. No data until 1970. Number of actual observations by date: 45.
Source name:
World Development Indicators
Source organization:
World Bank staff estimates using data from the United Nations Statistics Division's Statistical Yearbook, and the UNESCO Institute for Statistics online database.
Categories, topics:
Economy & Growth, Environment
Last updated:
apr 23, 2017
Indicators value changes by year
At the date of observation
Value
Absolute change
Change from previous value
jan 1, 1971
2.711
+2.711
0.0%
jan 1, 1972
2.505
-0.206
-7.59%
jan 1, 1973
2.612
+0.107
4.27%
jan 1, 1974
2.602
-0.01
-0.4%
jan 1, 1975
2.59
-0.012
-0.47%
jan 1, 1976
2.586
-0.003
-0.13%
jan 1, 1977
2.98
+0.393
15.2%
jan 1, 1978
2.835
-0.144
-4.84%
jan 1, 1979
3.155
+0.32
11.3%
jan 1, 1980
3.125
-0.03
-0.96%
jan 1, 1981
3.04
-0.085
-2.71%
jan 1, 1982
3.251
+0.21
6.92%
jan 1, 1983
3.393
+0.142
4.36%
jan 1, 1984
3.144
-0.249
-7.34%
jan 1, 1985
2.964
-0.18
-5.72%
jan 1, 1986
2.935
-0.029
-0.98%
jan 1, 1987
3.093
+0.158
5.38%
jan 1, 1988
3.158
+0.065
2.1%
jan 1, 1989
3.167
+0.009
0.28%
jan 1, 1990
3.312
+0.145
4.58%
jan 1, 1991
3.39
+0.079
2.38%
jan 1, 1992
3.444
+0.053
1.58%
jan 1, 1993
3.625
+0.181
5.26%
jan 1, 1994
3.735
+0.111
3.05%
jan 1, 1995
3.471
-0.265
-7.08%
jan 1, 1996
3.35
-0.121
-3.5%
jan 1, 1997
3.337
-0.012
-0.37%
jan 1, 1998
3.477
+0.14
4.19%
jan 1, 1999
3.503
+0.026
0.74%
jan 1, 2000
3.337
-0.166
-4.74%
jan 1, 2001
3.328
-0.009
-0.27%
jan 1, 2002
3.362
+0.034
1.02%
jan 1, 2003
3.264
-0.098
-2.92%
jan 1, 2004
3.291
+0.028
0.85%
jan 1, 2005
3.237
-0.054
-1.64%
jan 1, 2006
3.303
+0.066
2.04%
jan 1, 2007
3.287
-0.016
-0.49%
jan 1, 2008
3.277
-0.011
-0.32%
jan 1, 2009
3.305
+0.028
0.86%
jan 1, 2010
3.363
+0.058
1.77%
jan 1, 2011
3.329
-0.034
-1.02%
jan 1, 2012
3.332
+0.003
0.09%
jan 1, 2013
3.242
-0.089
-2.68%
jan 1, 2014
3.147
-0.096
-2.95%
jan 1, 2015
3.083
-0.064
-2.03%
Ranking of countries by current statistics by years


Comments: