29
/
en
AIzaSyAYiBZKx7MnpbEhh9jyipgxe19OcubqV5w
April 1, 2024
26266
Early-demographic dividend
EAR
false
2
1
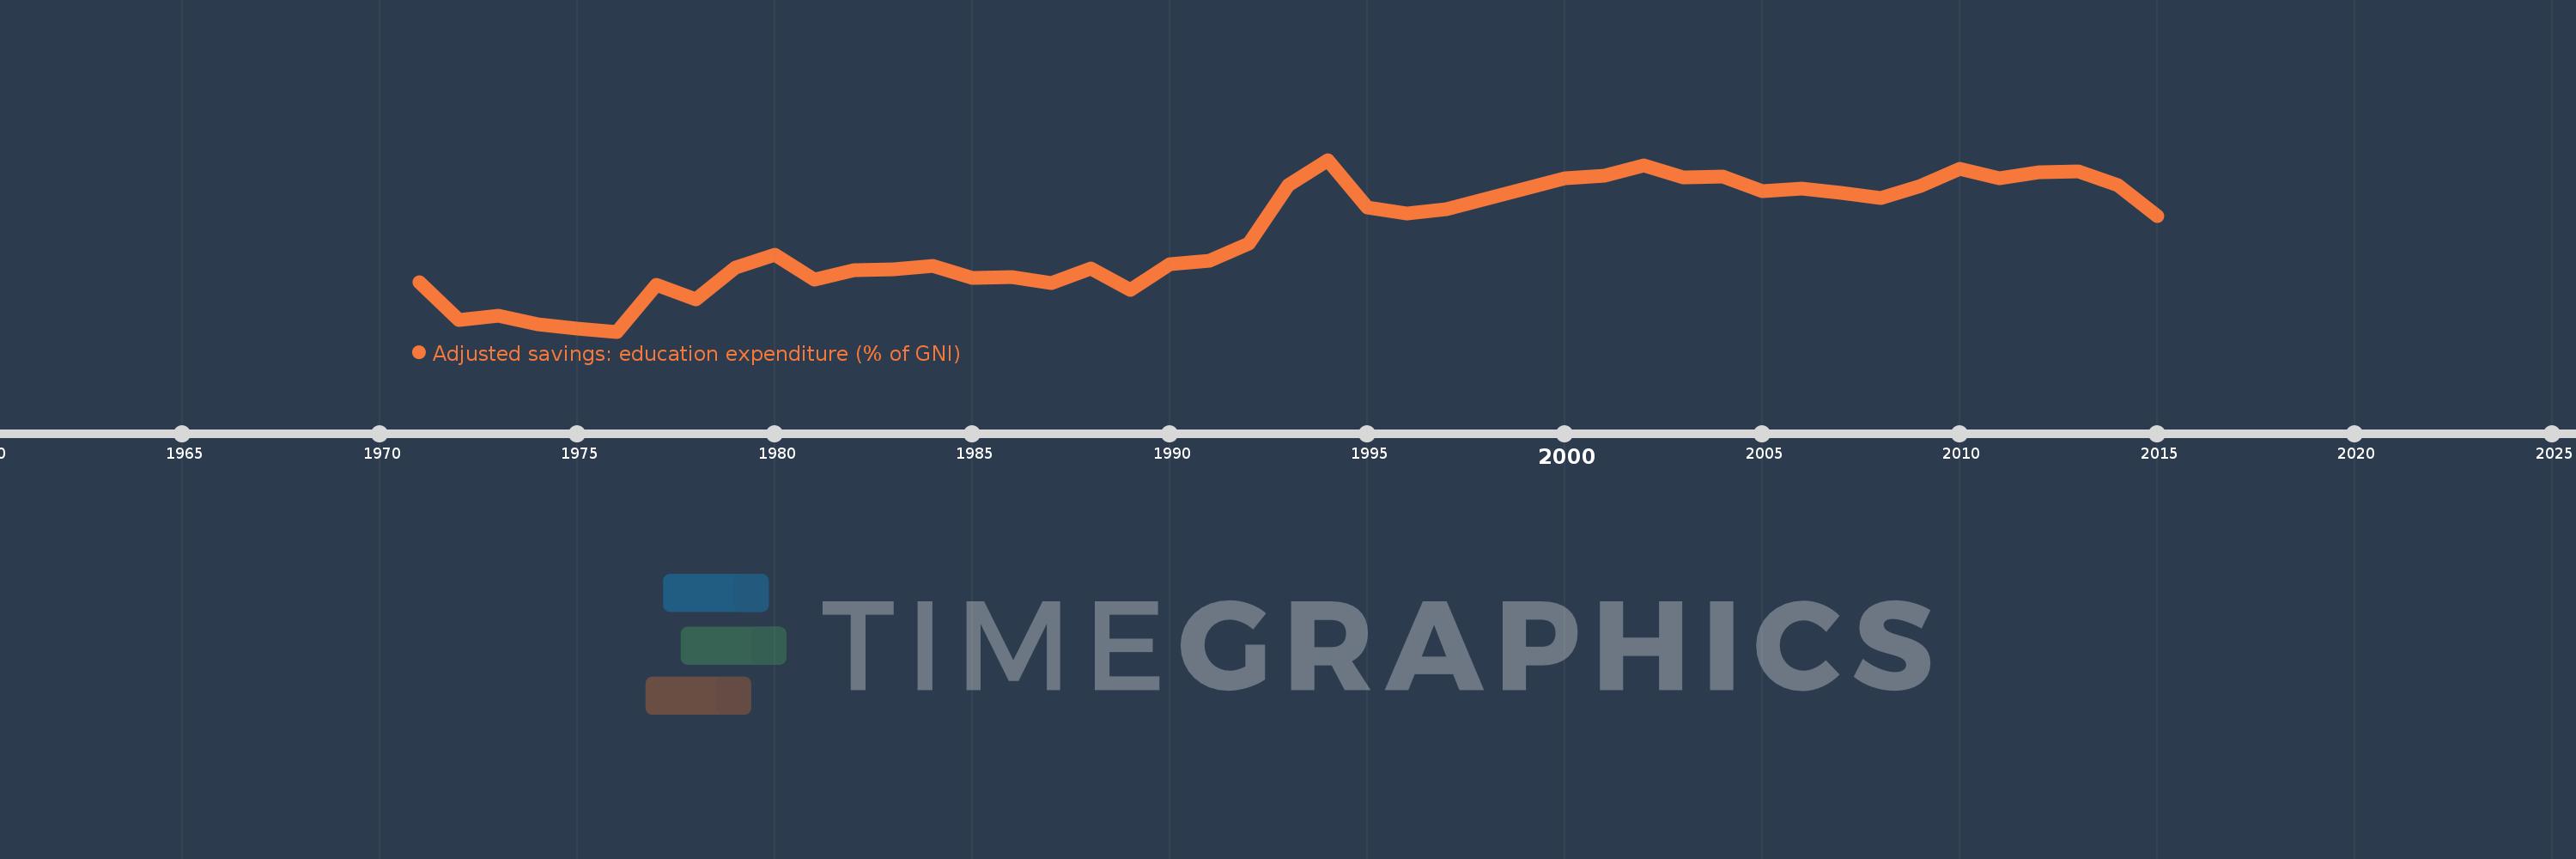
Adjusted savings: education expenditure (% of GNI)
2015,2014,2013,2012,2011,2010,2009,2008,2007,2006,2005,2004,2003,2002,2001,2000,1999,1998,1997,1996,1995,1994,1993,1992,1991,1990,1989,1988,1987,1986,1985,1984,1983,1982,1981,1980,1979,1978,1977,1976,1975,1974,1973,1972,1971
This statistics in other country:
AfghanistanAlbaniaAlgeriaAmerican SamoaAndorraAngolaAntigua and BarbudaArab WorldArgentinaArmeniaAustraliaAustriaAzerbaijanBahamas, TheBahrainBangladeshBarbadosBelarusBelgiumBelizeBeninBermudaBhutanBoliviaBotswanaBrazilBrunei DarussalamBulgariaBurkina FasoBurundiCabo VerdeCambodiaCameroonCanadaCaribbean small statesCentral African RepublicCentral Europe and the BalticsChadChileChinaColombiaComorosCongo, Dem. Rep.Congo, Rep.Costa RicaCote d'IvoireCroatiaCubaCyprusCzech RepublicDenmarkDjiboutiDominicaDominican RepublicEarly-demographic dividendEast Asia & PacificEast Asia & Pacific (excluding high income)East Asia & Pacific (IDA & IBRD countries)EcuadorEgypt, Arab Rep.El SalvadorEquatorial GuineaEritreaEstoniaEthiopiaEuro areaEurope & Central AsiaEurope & Central Asia (excluding high income)Europe & Central Asia (IDA & IBRD countries)European UnionFijiFinlandFragile and conflict affected situationsFranceFrench PolynesiaGabonGambia, TheGeorgiaGermanyGhanaGreeceGrenadaGuatemalaGuineaGuinea-BissauGuyanaHaitiHeavily indebted poor countries (HIPC)High incomeHondurasHong Kong SAR, ChinaHungaryIBRD onlyIcelandIDA & IBRD totalIDA blendIDA onlyIDA totalIndiaIndonesiaIran, Islamic Rep.IraqIrelandIsraelItalyJamaicaJapanJordanKazakhstanKenyaKiribatiKorea, Rep.KuwaitKyrgyz RepublicLao PDRLate-demographic dividendLatin America & Caribbean Latin America & Caribbean (excluding high income)Latin America & the Caribbean (IDA & IBRD countries)LatviaLeast developed countries: UN classificationLebanonLesothoLiberiaLibyaLiechtensteinLithuaniaLow & middle incomeLow incomeLower middle incomeLuxembourgMacao SAR, ChinaMacedonia, FYRMadagascarMalawiMalaysiaMaldivesMaliMaltaMarshall IslandsMauritaniaMauritiusMexicoMicronesia, Fed. Sts.Middle East & North AfricaMiddle East & North Africa (excluding high income)Middle East & North Africa (IDA & IBRD countries)Middle incomeMoldovaMonacoMongoliaMoroccoMozambiqueMyanmarNamibiaNepalNetherlandsNew CaledoniaNew ZealandNicaraguaNigerNigeriaNorth AmericaNorwayOECD membersOmanOther small statesPacific island small statesPakistanPanamaPapua New GuineaParaguayPeruPhilippinesPolandPortugalPost-demographic dividendPre-demographic dividendPuerto RicoQatarRomaniaRussian FederationRwandaSamoaSan MarinoSao Tome and PrincipeSaudi ArabiaSenegalSerbiaSeychellesSierra LeoneSingaporeSlovak RepublicSloveniaSmall statesSolomon IslandsSomaliaSouth AfricaSouth AsiaSouth Asia (IDA & IBRD)SpainSri LankaSt. Kitts and NevisSt. LuciaSt. Vincent and the GrenadinesSub-Saharan Africa Sub-Saharan Africa (excluding high income)Sub-Saharan Africa (IDA & IBRD countries)SudanSurinameSwazilandSwedenSwitzerlandSyrian Arab RepublicTajikistanTanzaniaThailandTimor-LesteTogoTongaTrinidad and TobagoTunisiaTurkeyTurkmenistanUgandaUkraineUnited KingdomUnited StatesUpper middle incomeUruguayUzbekistanVanuatuVenezuela, RBVietnamVirgin Islands (U.S.)WorldYemen, Rep.ZambiaZimbabwe Timeline:
This timeline shows a graph from 1971 to 2015 of Early-demographic dividend. No data until 1970. Number of actual observations by date: 45.
Source name:
World Development Indicators
Source organization:
World Bank staff estimates using data from the United Nations Statistics Division's Statistical Yearbook, and the UNESCO Institute for Statistics online database.
Categories, topics:
Economy & Growth, Environment
Last updated:
apr 23, 2017
Indicators value changes by year
At the date of observation
Value
Absolute change
Change from previous value
jan 1, 1971
3.142
+3.142
0.0%
jan 1, 1972
2.826
-0.316
-10.06%
jan 1, 1973
2.863
+0.037
1.31%
jan 1, 1974
2.795
-0.068
-2.37%
jan 1, 1975
2.76
-0.035
-1.26%
jan 1, 1976
2.734
-0.026
-0.94%
jan 1, 1977
3.116
+0.382
13.98%
jan 1, 1978
2.998
-0.118
-3.78%
jan 1, 1979
3.258
+0.26
8.68%
jan 1, 1980
3.367
+0.109
3.34%
jan 1, 1981
3.158
-0.21
-6.23%
jan 1, 1982
3.24
+0.082
2.59%
jan 1, 1983
3.246
+0.006
0.19%
jan 1, 1984
3.273
+0.027
0.84%
jan 1, 1985
3.177
-0.096
-2.94%
jan 1, 1986
3.185
+0.008
0.26%
jan 1, 1987
3.131
-0.054
-1.71%
jan 1, 1988
3.252
+0.122
3.89%
jan 1, 1989
3.074
-0.178
-5.47%
jan 1, 1990
3.286
+0.212
6.89%
jan 1, 1991
3.314
+0.028
0.85%
jan 1, 1992
3.457
+0.143
4.3%
jan 1, 1993
3.939
+0.483
13.97%
jan 1, 1994
4.146
+0.207
5.26%
jan 1, 1995
3.756
-0.391
-9.42%
jan 1, 1996
3.704
-0.052
-1.39%
jan 1, 1997
3.739
+0.035
0.96%
jan 1, 1998
3.828
+0.089
2.38%
jan 1, 1999
3.907
+0.079
2.06%
jan 1, 2000
3.994
+0.088
2.24%
jan 1, 2001
4.014
+0.019
0.49%
jan 1, 2002
4.099
+0.086
2.13%
jan 1, 2003
4.002
-0.098
-2.38%
jan 1, 2004
4.01
+0.009
0.22%
jan 1, 2005
3.885
-0.126
-3.14%
jan 1, 2006
3.909
+0.024
0.63%
jan 1, 2007
3.875
-0.034
-0.87%
jan 1, 2008
3.833
-0.042
-1.08%
jan 1, 2009
3.932
+0.099
2.58%
jan 1, 2010
4.074
+0.142
3.61%
jan 1, 2011
3.992
-0.082
-2.02%
jan 1, 2012
4.042
+0.05
1.25%
jan 1, 2013
4.052
+0.011
0.26%
jan 1, 2014
3.937
-0.116
-2.85%
jan 1, 2015
3.684
-0.253
-6.42%
Ranking of countries by current statistics by years


Comments: