29
/
en
AIzaSyAYiBZKx7MnpbEhh9jyipgxe19OcubqV5w
April 1, 2024
54534
Post-demographic dividend
PST
false
2
1
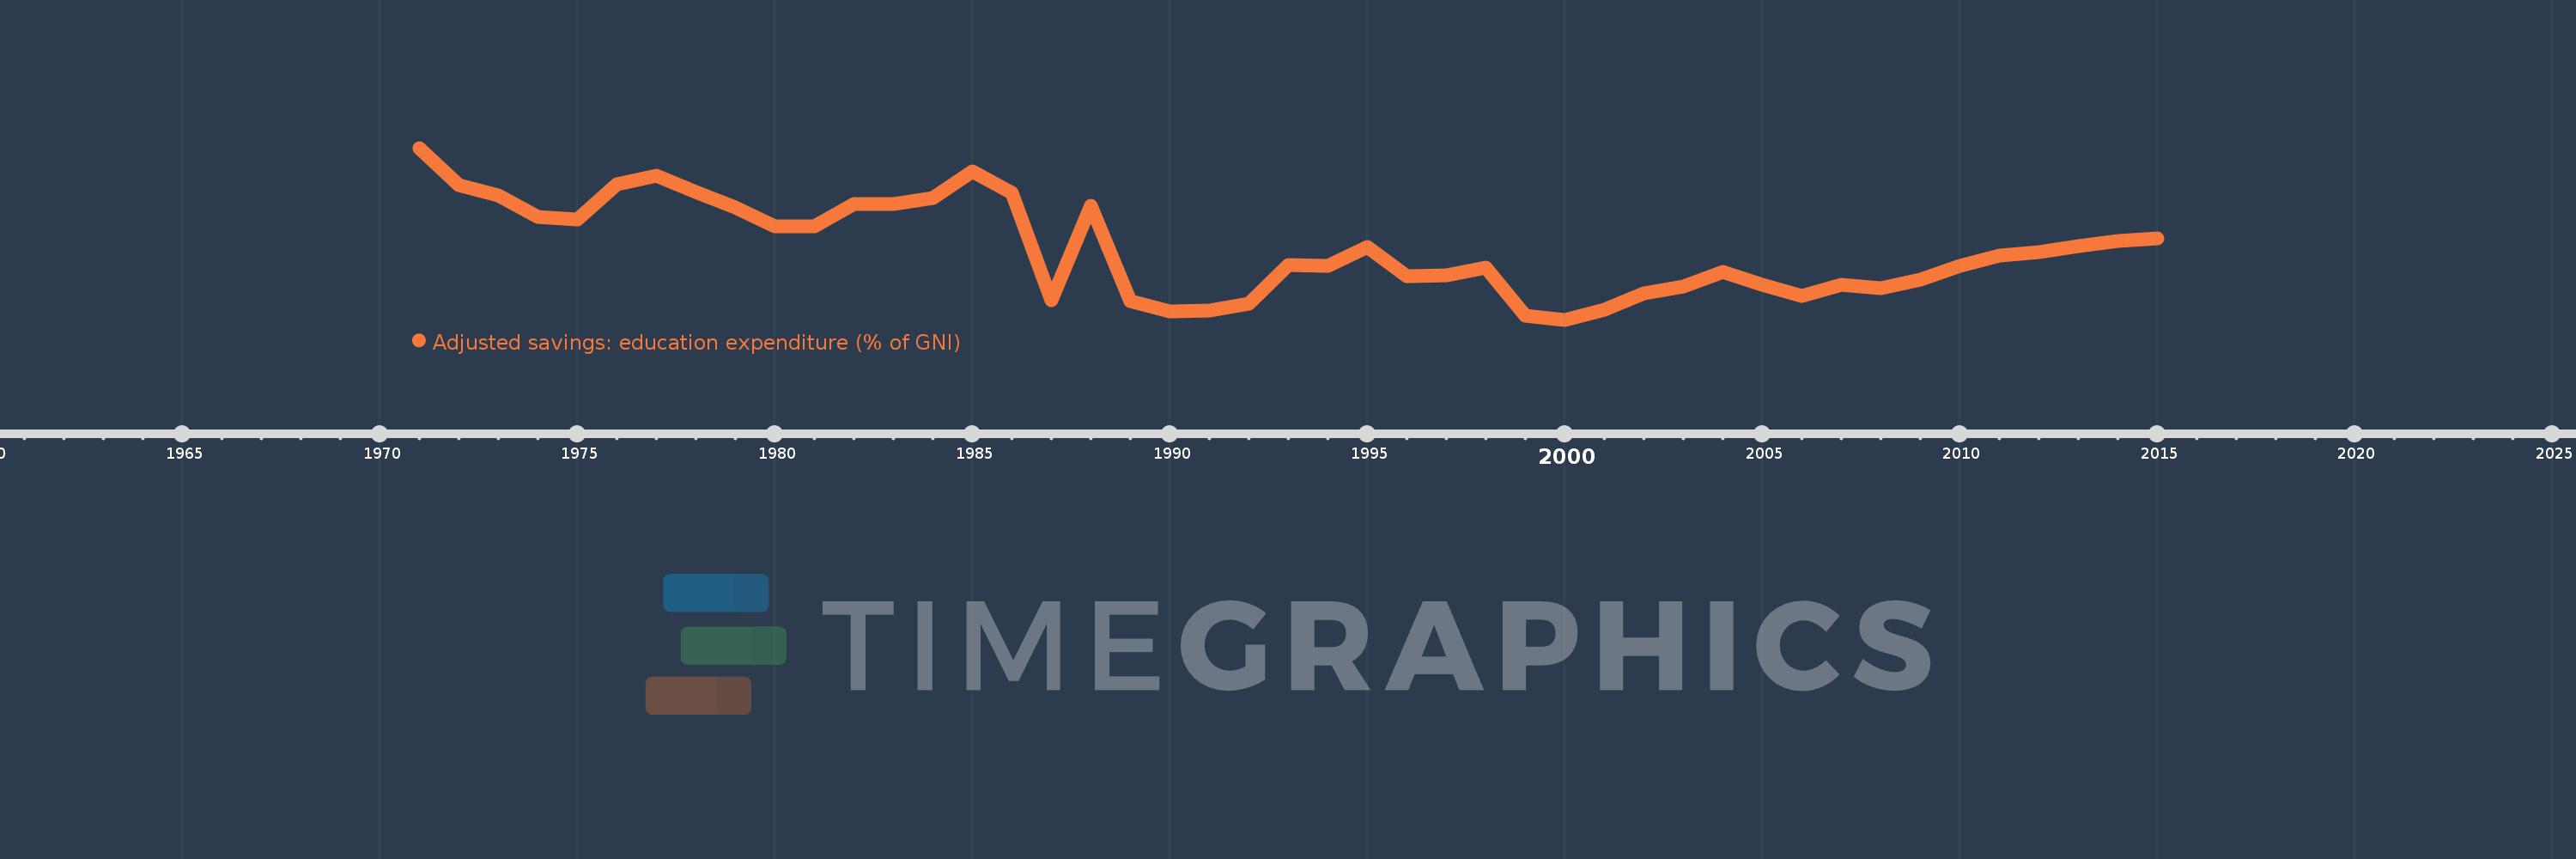
Adjusted savings: education expenditure (% of GNI)
2015,2014,2013,2012,2011,2010,2009,2008,2007,2006,2005,2004,2003,2002,2001,2000,1999,1998,1997,1996,1995,1994,1993,1992,1991,1990,1989,1988,1987,1986,1985,1984,1983,1982,1981,1980,1979,1978,1977,1976,1975,1974,1973,1972,1971
This statistics in other country:
AfghanistanAlbaniaAlgeriaAmerican SamoaAndorraAngolaAntigua and BarbudaArab WorldArgentinaArmeniaAustraliaAustriaAzerbaijanBahamas, TheBahrainBangladeshBarbadosBelarusBelgiumBelizeBeninBermudaBhutanBoliviaBotswanaBrazilBrunei DarussalamBulgariaBurkina FasoBurundiCabo VerdeCambodiaCameroonCanadaCaribbean small statesCentral African RepublicCentral Europe and the BalticsChadChileChinaColombiaComorosCongo, Dem. Rep.Congo, Rep.Costa RicaCote d'IvoireCroatiaCubaCyprusCzech RepublicDenmarkDjiboutiDominicaDominican RepublicEarly-demographic dividendEast Asia & PacificEast Asia & Pacific (excluding high income)East Asia & Pacific (IDA & IBRD countries)EcuadorEgypt, Arab Rep.El SalvadorEquatorial GuineaEritreaEstoniaEthiopiaEuro areaEurope & Central AsiaEurope & Central Asia (excluding high income)Europe & Central Asia (IDA & IBRD countries)European UnionFijiFinlandFragile and conflict affected situationsFranceFrench PolynesiaGabonGambia, TheGeorgiaGermanyGhanaGreeceGrenadaGuatemalaGuineaGuinea-BissauGuyanaHaitiHeavily indebted poor countries (HIPC)High incomeHondurasHong Kong SAR, ChinaHungaryIBRD onlyIcelandIDA & IBRD totalIDA blendIDA onlyIDA totalIndiaIndonesiaIran, Islamic Rep.IraqIrelandIsraelItalyJamaicaJapanJordanKazakhstanKenyaKiribatiKorea, Rep.KuwaitKyrgyz RepublicLao PDRLate-demographic dividendLatin America & Caribbean Latin America & Caribbean (excluding high income)Latin America & the Caribbean (IDA & IBRD countries)LatviaLeast developed countries: UN classificationLebanonLesothoLiberiaLibyaLiechtensteinLithuaniaLow & middle incomeLow incomeLower middle incomeLuxembourgMacao SAR, ChinaMacedonia, FYRMadagascarMalawiMalaysiaMaldivesMaliMaltaMarshall IslandsMauritaniaMauritiusMexicoMicronesia, Fed. Sts.Middle East & North AfricaMiddle East & North Africa (excluding high income)Middle East & North Africa (IDA & IBRD countries)Middle incomeMoldovaMonacoMongoliaMoroccoMozambiqueMyanmarNamibiaNepalNetherlandsNew CaledoniaNew ZealandNicaraguaNigerNigeriaNorth AmericaNorwayOECD membersOmanOther small statesPacific island small statesPakistanPanamaPapua New GuineaParaguayPeruPhilippinesPolandPortugalPost-demographic dividendPre-demographic dividendPuerto RicoQatarRomaniaRussian FederationRwandaSamoaSan MarinoSao Tome and PrincipeSaudi ArabiaSenegalSerbiaSeychellesSierra LeoneSingaporeSlovak RepublicSloveniaSmall statesSolomon IslandsSomaliaSouth AfricaSouth AsiaSouth Asia (IDA & IBRD)SpainSri LankaSt. Kitts and NevisSt. LuciaSt. Vincent and the GrenadinesSub-Saharan Africa Sub-Saharan Africa (excluding high income)Sub-Saharan Africa (IDA & IBRD countries)SudanSurinameSwazilandSwedenSwitzerlandSyrian Arab RepublicTajikistanTanzaniaThailandTimor-LesteTogoTongaTrinidad and TobagoTunisiaTurkeyTurkmenistanUgandaUkraineUnited KingdomUnited StatesUpper middle incomeUruguayUzbekistanVanuatuVenezuela, RBVietnamVirgin Islands (U.S.)WorldYemen, Rep.ZambiaZimbabwe Timeline:
This timeline shows a graph from 1971 to 2015 of Post-demographic dividend. No data until 1970. Number of actual observations by date: 45.
Source name:
World Development Indicators
Source organization:
World Bank staff estimates using data from the United Nations Statistics Division's Statistical Yearbook, and the UNESCO Institute for Statistics online database.
Categories, topics:
Economy & Growth, Environment
Last updated:
apr 23, 2017
Indicators value changes by year
At the date of observation
Value
Absolute change
Change from previous value
jan 1, 1971
5.57
+5.57
0.0%
jan 1, 1972
5.258
-0.313
-5.61%
jan 1, 1973
5.172
-0.086
-1.64%
jan 1, 1974
4.996
-0.176
-3.4%
jan 1, 1975
4.974
-0.022
-0.45%
jan 1, 1976
5.268
+0.294
5.91%
jan 1, 1977
5.34
+0.072
1.37%
jan 1, 1978
5.201
-0.139
-2.6%
jan 1, 1979
5.074
-0.127
-2.44%
jan 1, 1980
4.915
-0.158
-3.12%
jan 1, 1981
4.916
+0.001
0.01%
jan 1, 1982
5.103
+0.187
3.8%
jan 1, 1983
5.106
+0.003
0.06%
jan 1, 1984
5.155
+0.049
0.96%
jan 1, 1985
5.372
+0.217
4.21%
jan 1, 1986
5.197
-0.175
-3.26%
jan 1, 1987
4.301
-0.896
-17.25%
jan 1, 1988
5.091
+0.79
18.38%
jan 1, 1989
4.294
-0.797
-15.65%
jan 1, 1990
4.208
-0.086
-2.01%
jan 1, 1991
4.217
+0.008
0.2%
jan 1, 1992
4.276
+0.059
1.4%
jan 1, 1993
4.596
+0.32
7.49%
jan 1, 1994
4.588
-0.008
-0.17%
jan 1, 1995
4.745
+0.157
3.43%
jan 1, 1996
4.499
-0.246
-5.18%
jan 1, 1997
4.512
+0.013
0.29%
jan 1, 1998
4.571
+0.059
1.31%
jan 1, 1999
4.171
-0.4
-8.75%
jan 1, 2000
4.139
-0.032
-0.77%
jan 1, 2001
4.22
+0.081
1.96%
jan 1, 2002
4.36
+0.14
3.31%
jan 1, 2003
4.419
+0.059
1.34%
jan 1, 2004
4.539
+0.121
2.73%
jan 1, 2005
4.429
-0.111
-2.44%
jan 1, 2006
4.335
-0.094
-2.12%
jan 1, 2007
4.427
+0.092
2.13%
jan 1, 2008
4.405
-0.022
-0.5%
jan 1, 2009
4.473
+0.068
1.54%
jan 1, 2010
4.585
+0.113
2.52%
jan 1, 2011
4.673
+0.087
1.9%
jan 1, 2012
4.703
+0.03
0.65%
jan 1, 2013
4.755
+0.051
1.09%
jan 1, 2014
4.793
+0.038
0.8%
jan 1, 2015
4.814
+0.022
0.45%
Ranking of countries by current statistics by years


Comments: