29
/
en
AIzaSyAYiBZKx7MnpbEhh9jyipgxe19OcubqV5w
April 1, 2024
54582
Post-demographic dividend
PST
false
2
1
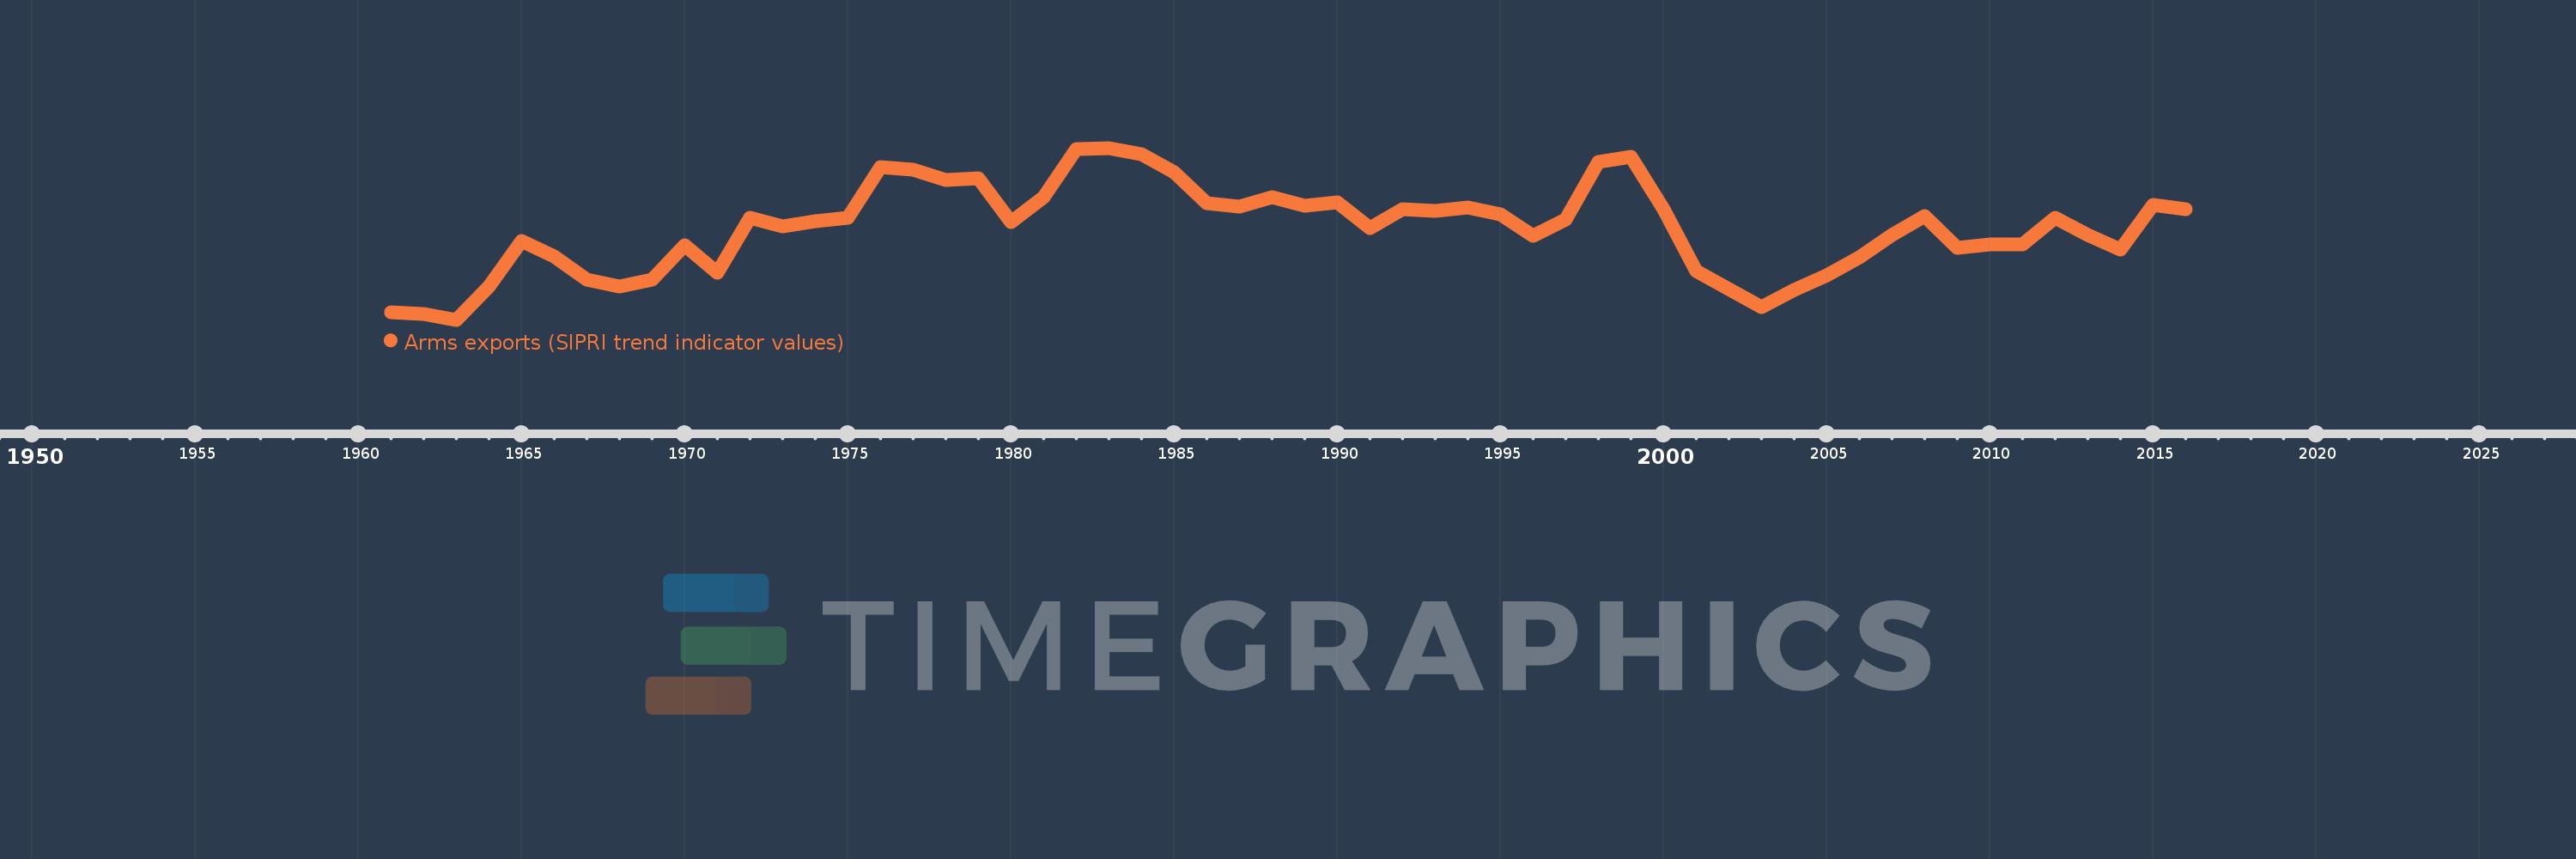
Arms exports (SIPRI trend indicator values)
2016,2015,2014,2013,2012,2011,2010,2009,2008,2007,2006,2005,2004,2003,2002,2001,2000,1999,1998,1997,1996,1995,1994,1993,1992,1991,1990,1989,1988,1987,1986,1985,1984,1983,1982,1981,1980,1979,1978,1977,1976,1975,1974,1973,1972,1971,1970,1969,1968,1967,1966,1965,1964,1963,1962,1961
This statistics in other country:
Timeline:
This timeline shows a graph from 1961 to 2016 of Post-demographic dividend. No data until 1960. Number of actual observations by date: 56.
Source name:
World Development Indicators
Source organization:
Stockholm International Peace Research Institute (SIPRI), Arms Transfers Programme (http://portal.sipri.org/publications/pages/transfer/splash).
Categories, topics:
Public Sector, Trade
Last updated:
apr 23, 2017
Indicators value changes by year
Minimum:
9.206 bln
jan 1, 1963
Maximum:
25.765 bln
jan 1, 1983
At the date of observation
Value
Absolute change
Change from previous value
jan 1, 1961
9.922 bln
+9.922 bln
0.0%
jan 1, 1962
9.789 bln
-133.0 mln
-1.34%
jan 1, 1963
9.206 bln
-583.0 mln
-5.96%
jan 1, 1964
12.374 bln
+3.168 bln
34.41%
jan 1, 1965
16.781 bln
+4.407 bln
35.61%
jan 1, 1966
15.28 bln
-1.501 bln
-8.94%
jan 1, 1967
13.107 bln
-2.173 bln
-14.22%
jan 1, 1968
12.382 bln
-725.0 mln
-5.53%
jan 1, 1969
13.068 bln
+686.0 mln
5.54%
jan 1, 1970
16.344 bln
+3.276 bln
25.07%
jan 1, 1971
13.769 bln
-2.575 bln
-15.76%
jan 1, 1972
19.048 bln
+5.279 bln
38.34%
jan 1, 1973
18.239 bln
-809.0 mln
-4.25%
jan 1, 1974
18.736 bln
+497.0 mln
2.72%
jan 1, 1975
19.014 bln
+278.0 mln
1.48%
jan 1, 1976
23.927 bln
+4.913 bln
25.84%
jan 1, 1977
23.666 bln
-261.0 mln
-1.09%
jan 1, 1978
22.648 bln
-1.018 bln
-4.3%
jan 1, 1979
22.819 bln
+171.0 mln
0.76%
jan 1, 1980
18.622 bln
-4.197 bln
-18.39%
jan 1, 1981
20.99 bln
+2.368 bln
12.72%
jan 1, 1982
25.685 bln
+4.695 bln
22.37%
jan 1, 1983
25.765 bln
+80.0 mln
0.31%
jan 1, 1984
25.151 bln
-614.0 mln
-2.38%
jan 1, 1985
23.423 bln
-1.728 bln
-6.87%
jan 1, 1986
20.457 bln
-2.966 bln
-12.66%
jan 1, 1987
20.111 bln
-346.0 mln
-1.69%
jan 1, 1988
21.012 bln
+901.0 mln
4.48%
jan 1, 1989
20.206 bln
-806.0 mln
-3.84%
jan 1, 1990
20.512 bln
+306.0 mln
1.51%
jan 1, 1991
18.079 bln
-2.433 bln
-11.86%
jan 1, 1992
19.828 bln
+1.749 bln
9.67%
jan 1, 1993
19.703 bln
-125.0 mln
-0.63%
jan 1, 1994
19.987 bln
+284.0 mln
1.44%
jan 1, 1995
19.4 bln
-587.0 mln
-2.94%
jan 1, 1996
17.259 bln
-2.141 bln
-11.04%
jan 1, 1997
18.861 bln
+1.602 bln
9.28%
jan 1, 1998
24.393 bln
+5.532 bln
29.33%
jan 1, 1999
24.925 bln
+532.0 mln
2.18%
jan 1, 2000
19.823 bln
-5.102 bln
-20.47%
jan 1, 2001
13.867 bln
-5.956 bln
-30.05%
jan 1, 2002
12.166 bln
-1.701 bln
-12.27%
jan 1, 2003
10.459 bln
-1.707 bln
-14.03%
jan 1, 2004
12.055 bln
+1.596 bln
15.26%
jan 1, 2005
13.519 bln
+1.464 bln
12.14%
jan 1, 2006
15.228 bln
+1.709 bln
12.64%
jan 1, 2007
17.409 bln
+2.181 bln
14.32%
jan 1, 2008
19.169 bln
+1.76 bln
10.11%
jan 1, 2009
16.125 bln
-3.044 bln
-15.88%
jan 1, 2010
16.445 bln
+320.0 mln
1.98%
jan 1, 2011
16.457 bln
+12.0 mln
0.07%
jan 1, 2012
19.006 bln
+2.549 bln
15.49%
jan 1, 2013
17.388 bln
-1.618 bln
-8.51%
jan 1, 2014
16.005 bln
-1.383 bln
-7.95%
jan 1, 2015
20.242 bln
+4.237 bln
26.47%
jan 1, 2016
19.862 bln
-380.0 mln
-1.88%
Ranking of countries by current statistics by years


Comments: