29
/
en
AIzaSyAYiBZKx7MnpbEhh9jyipgxe19OcubqV5w
April 1, 2024
27092
East Asia & Pacific
EAS
false
2
1
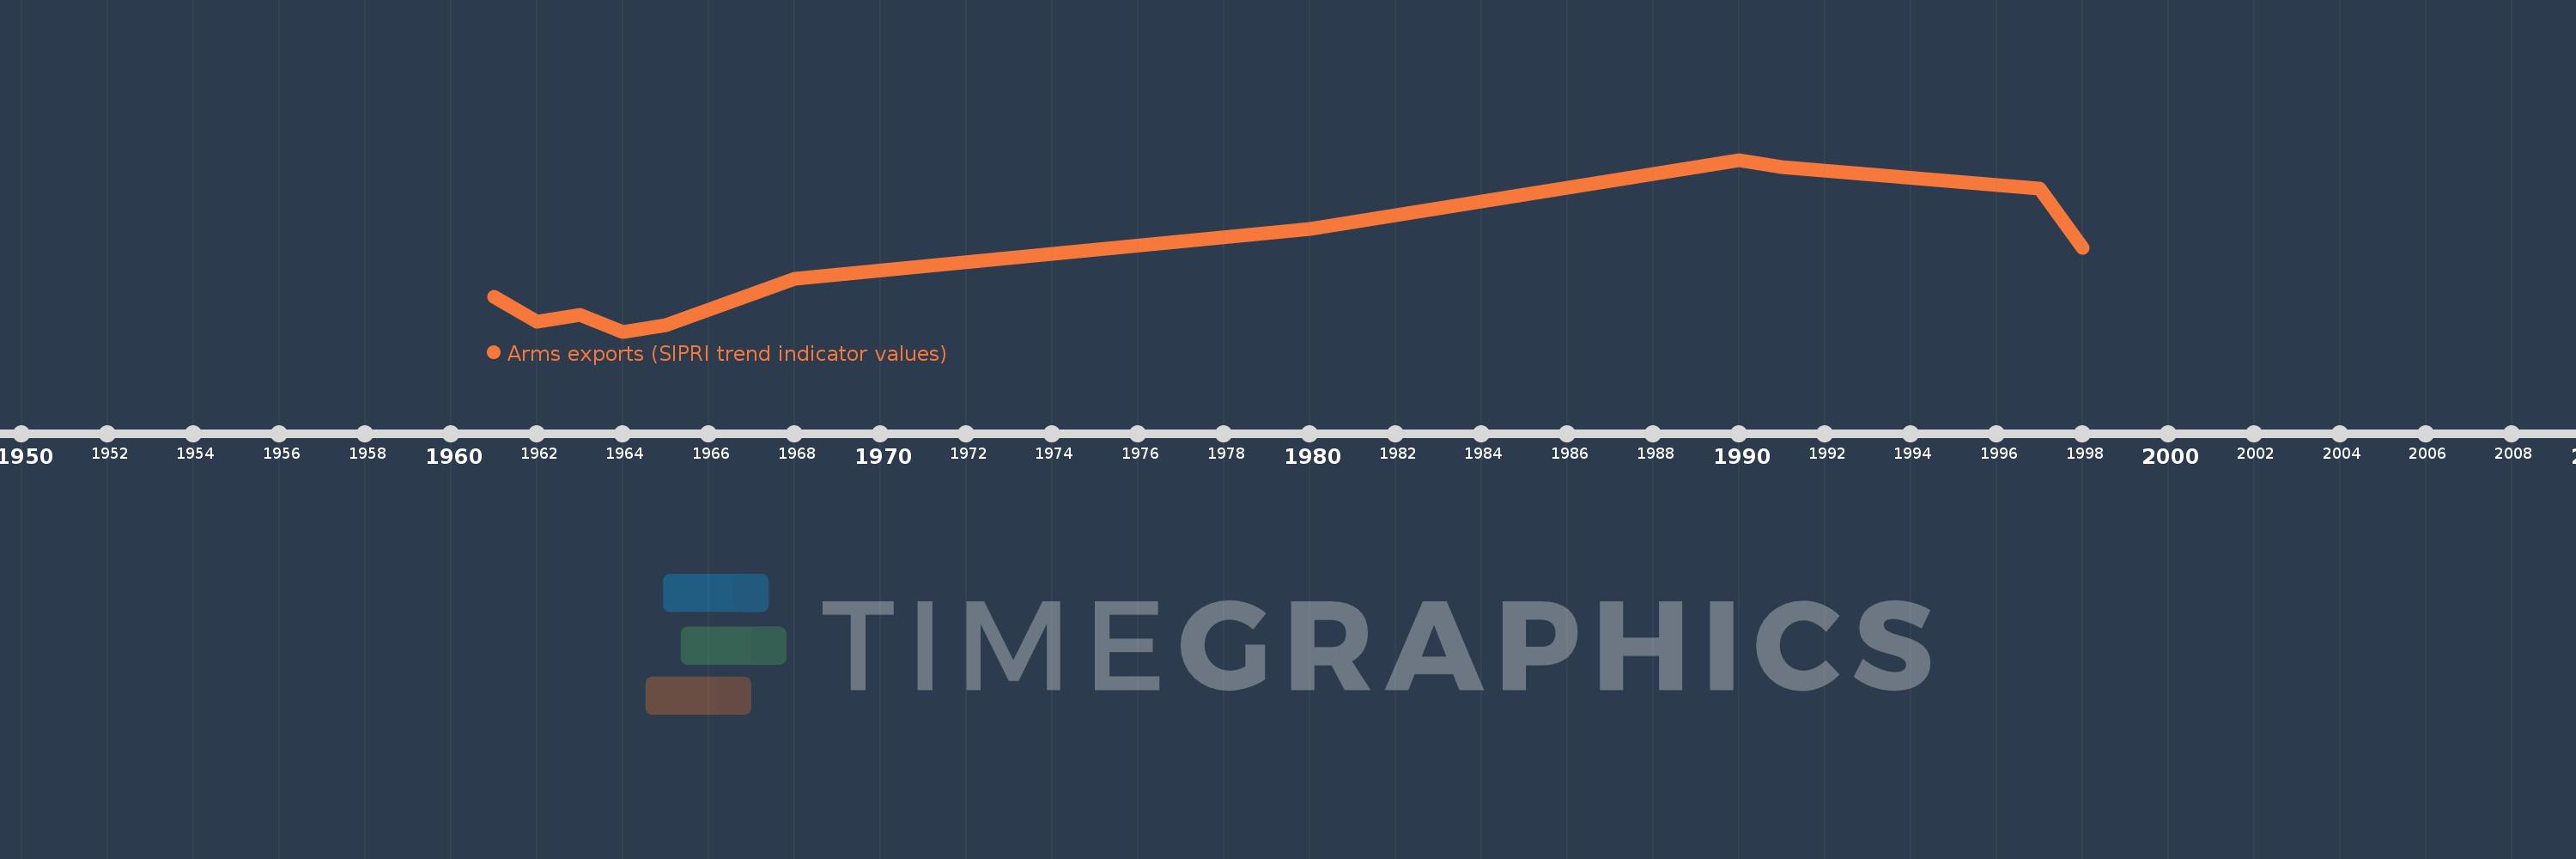
Arms exports (SIPRI trend indicator values)
1998,1997,1991,1990,1980,1968,1965,1964,1963,1962,1961
This statistics in other country:
Timeline:
This timeline shows a graph from 1961 to 1998 of East Asia & Pacific. No data until 1960. Number of actual observations by date: 11.
Source name:
World Development Indicators
Source organization:
Stockholm International Peace Research Institute (SIPRI), Arms Transfers Programme (http://portal.sipri.org/publications/pages/transfer/splash).
Categories, topics:
Public Sector, Trade
Last updated:
apr 23, 2017
Indicators value changes by year
Minimum:
26.0 mln
jan 1, 1964
Maximum:
1.308 bln
jan 1, 1990
At the date of observation
Value
Absolute change
Change from previous value
jan 1, 1961
286.0 mln
+286.0 mln
0.0%
jan 1, 1962
98.0 mln
-188.0 mln
-65.73%
jan 1, 1963
153.0 mln
+55.0 mln
56.12%
jan 1, 1964
26.0 mln
-127.0 mln
-83.01%
jan 1, 1965
75.0 mln
+49.0 mln
188.46%
jan 1, 1968
423.0 mln
+348.0 mln
464.0%
jan 1, 1980
791.0 mln
+368.0 mln
87.0%
jan 1, 1990
1.308 bln
+517.0 mln
65.36%
jan 1, 1991
1.255 bln
-53.0 mln
-4.05%
jan 1, 1997
1.091 bln
-164.0 mln
-13.07%
jan 1, 1998
653.0 mln
-438.0 mln
-40.15%
Ranking of countries by current statistics by years


Comments: