29
/
en
AIzaSyAYiBZKx7MnpbEhh9jyipgxe19OcubqV5w
April 1, 2024
274548
United Arab Emirates
ARE
true
2
1
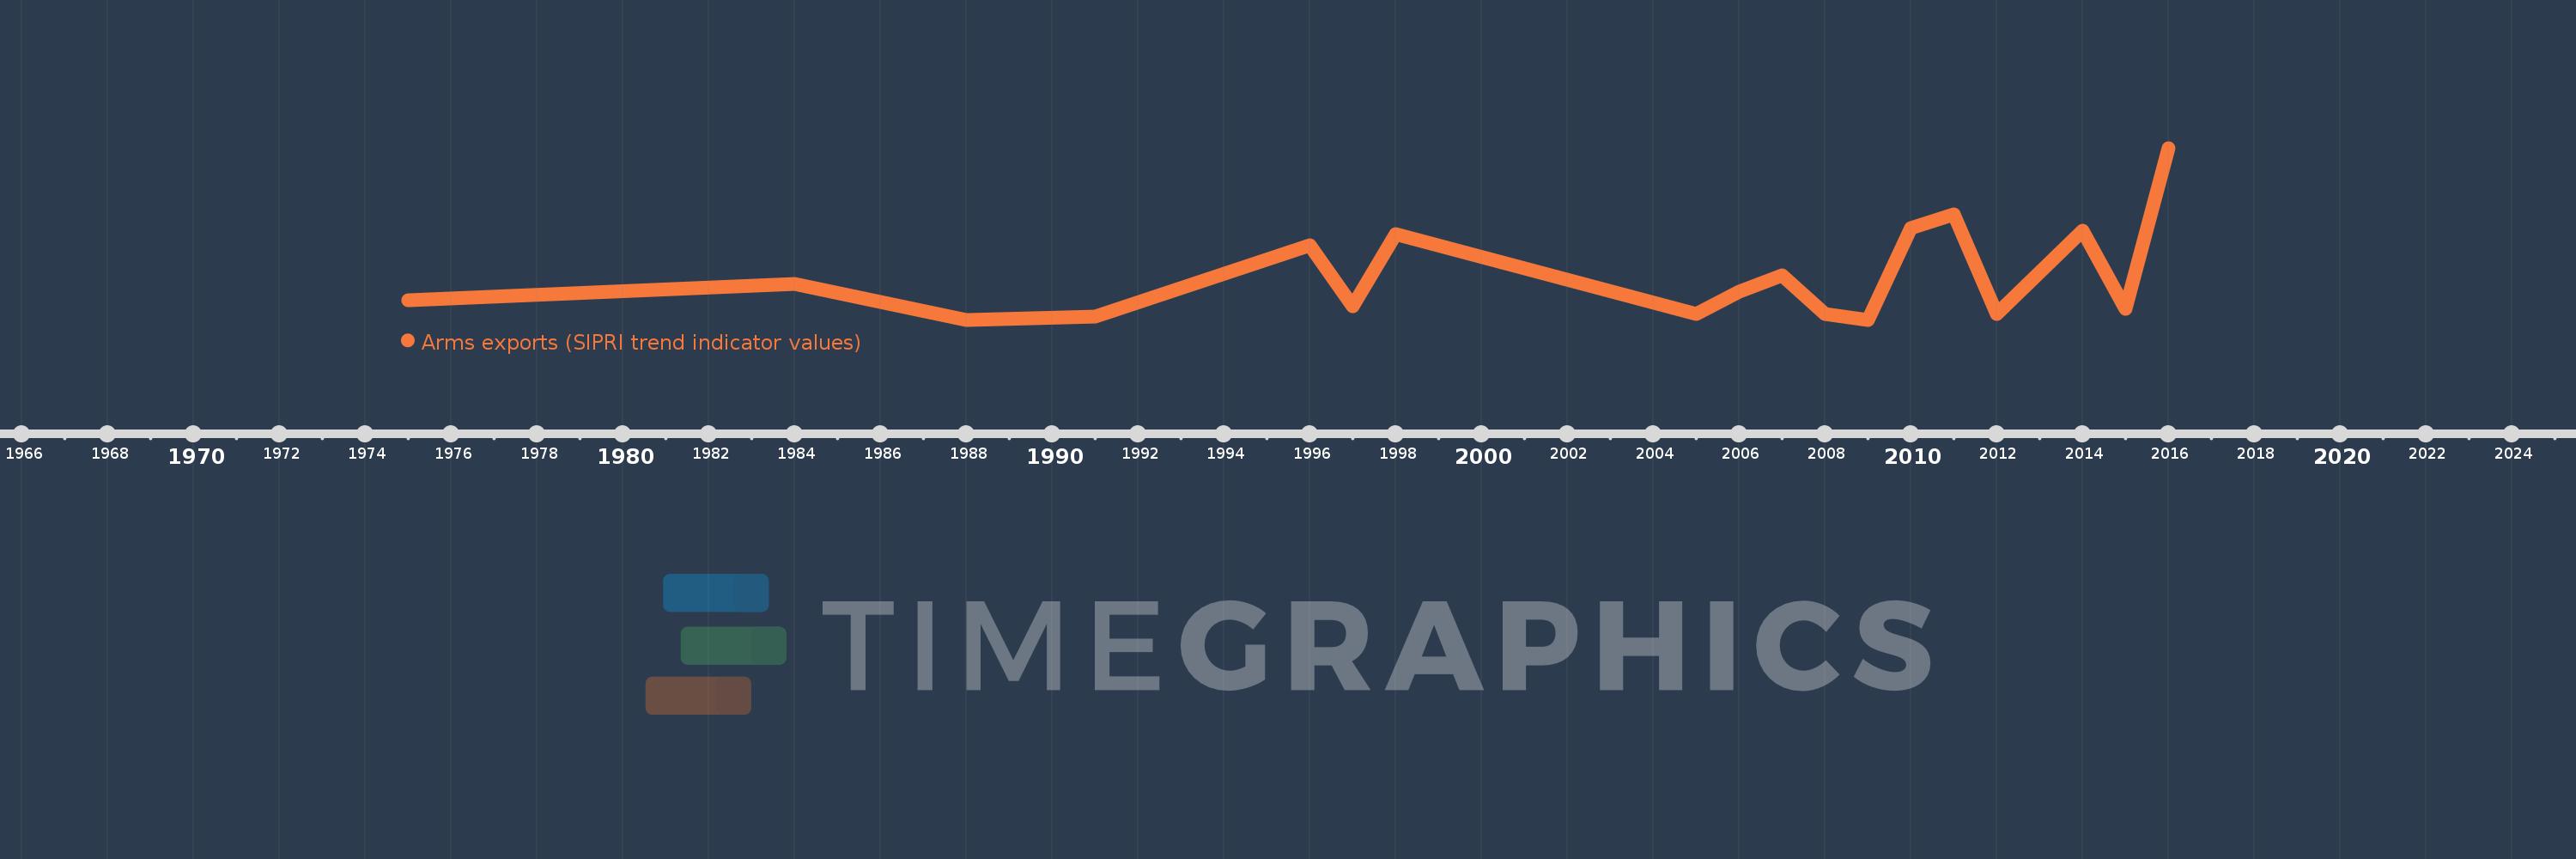
Arms exports (SIPRI trend indicator values)
2016,2015,2014,2012,2011,2010,2009,2008,2007,2006,2005,1998,1997,1996,1991,1988,1984,1975
This statistics in other country:
Timeline:
This timeline shows a graph from 1975 to 2016 of United Arab Emirates. No data until 1974. Number of actual observations by date: 18.
Source name:
World Development Indicators
Source organization:
Stockholm International Peace Research Institute (SIPRI), Arms Transfers Programme (http://portal.sipri.org/publications/pages/transfer/splash).
Categories, topics:
Public Sector, Trade
Last updated:
apr 23, 2017
Indicators value changes by year
Minimum:
1000.0K
jan 1, 1988
Maximum:
63.0 mln
jan 1, 2016
At the date of observation
Value
Absolute change
Change from previous value
jan 1, 1975
8.0 mln
+8.0 mln
0.0%
jan 1, 1984
14.0 mln
+6.0 mln
75.0%
jan 1, 1988
1000.0K
-13.0 mln
-92.86%
jan 1, 1991
2.0 mln
+1000.0K
100.0%
jan 1, 1996
28.0 mln
+26.0 mln
1.3K%
jan 1, 1997
6.0 mln
-22.0 mln
-78.57%
jan 1, 1998
32.0 mln
+26.0 mln
433.33%
jan 1, 2005
3.0 mln
-29.0 mln
-90.63%
jan 1, 2006
11.0 mln
+8.0 mln
266.67%
jan 1, 2007
17.0 mln
+6.0 mln
54.55%
jan 1, 2008
3.0 mln
-14.0 mln
-82.35%
jan 1, 2009
1000.0K
-2.0 mln
-66.67%
jan 1, 2010
34.0 mln
+33.0 mln
3.3K%
jan 1, 2011
39.0 mln
+5.0 mln
14.71%
jan 1, 2012
3.0 mln
-36.0 mln
-92.31%
jan 1, 2014
33.0 mln
+30.0 mln
1000.0%
jan 1, 2015
5.0 mln
-28.0 mln
-84.85%
jan 1, 2016
63.0 mln
+58.0 mln
1.16K%
Ranking of countries by current statistics by years


Comments: