29
/
en
AIzaSyAYiBZKx7MnpbEhh9jyipgxe19OcubqV5w
April 1, 2024
33246
European Union
EUU
false
2
1
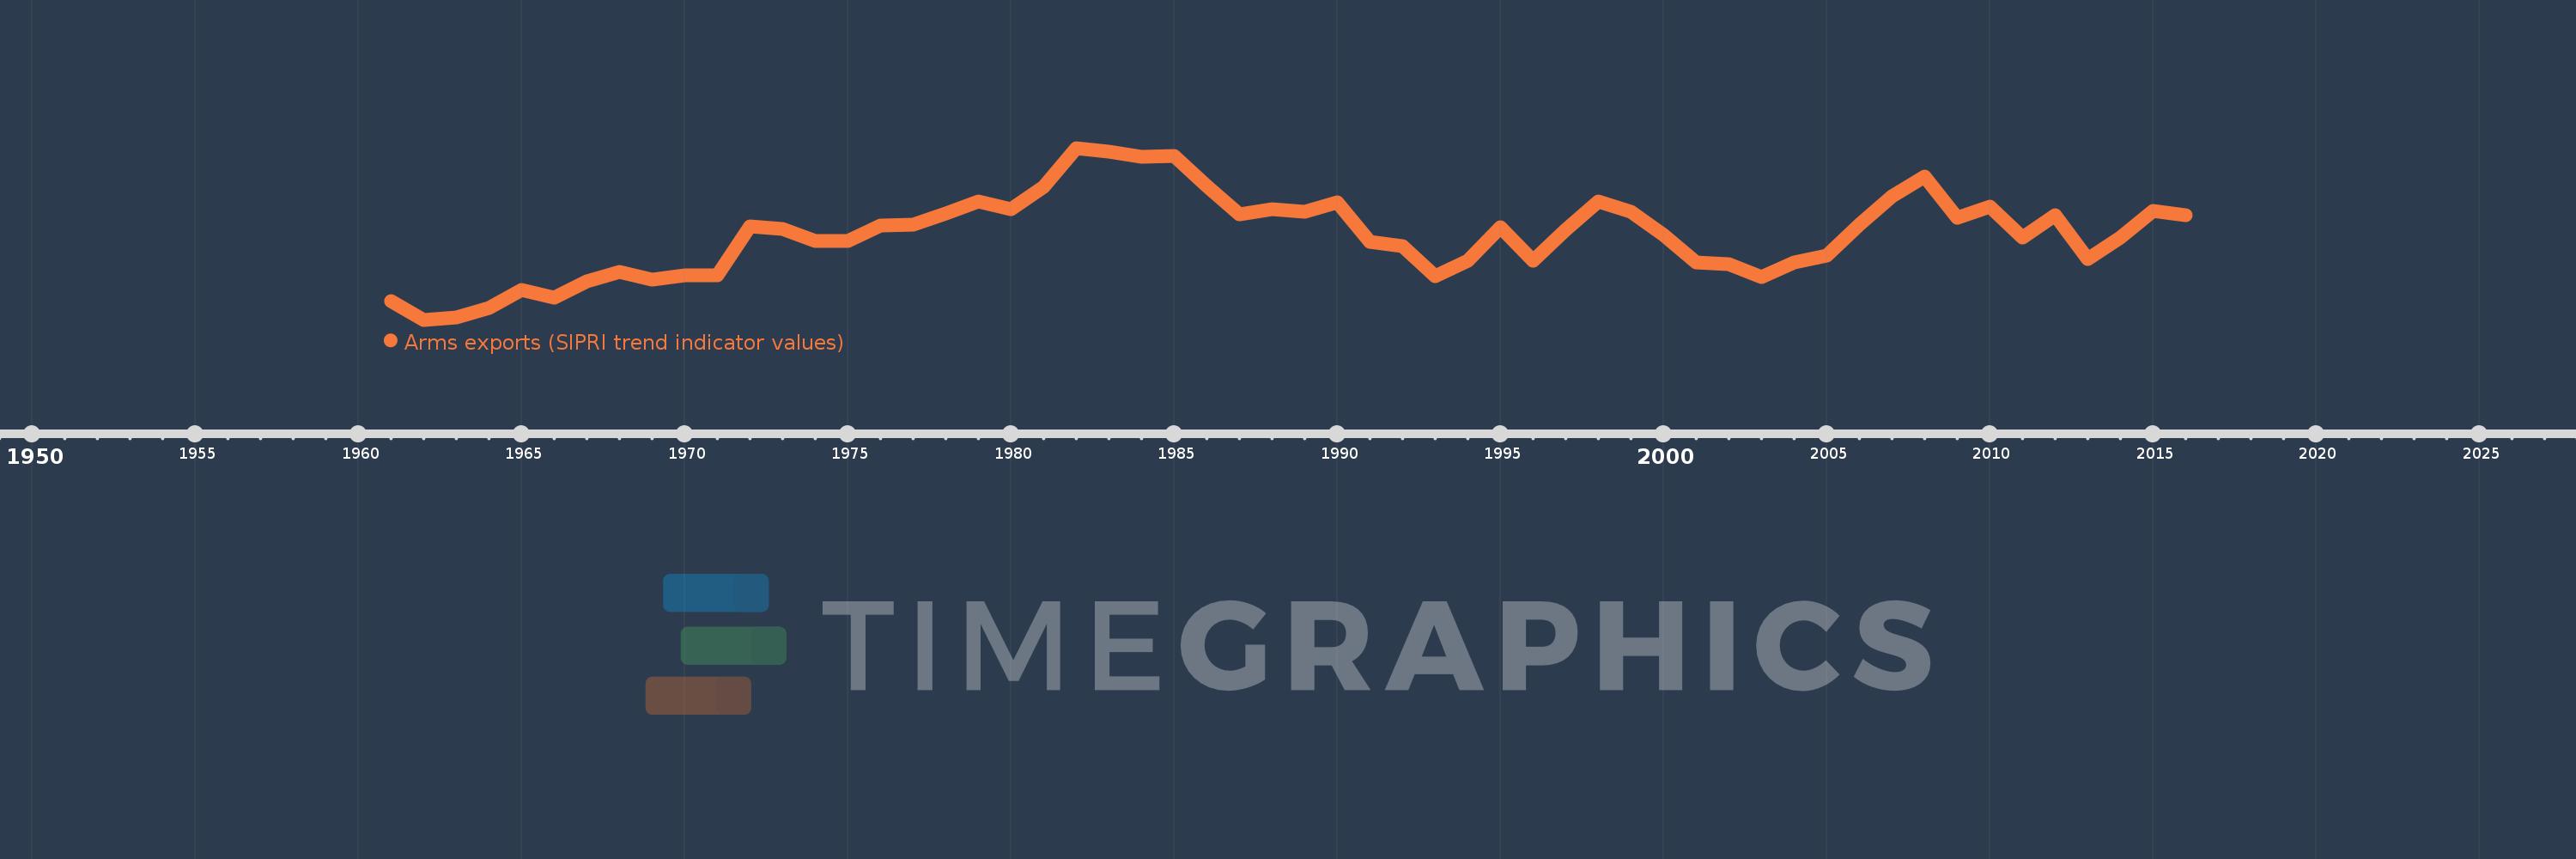
Arms exports (SIPRI trend indicator values)
2016,2015,2014,2013,2012,2011,2010,2009,2008,2007,2006,2005,2004,2003,2002,2001,2000,1999,1998,1997,1996,1995,1994,1993,1992,1991,1990,1989,1988,1987,1986,1985,1984,1983,1982,1981,1980,1979,1978,1977,1976,1975,1974,1973,1972,1971,1970,1969,1968,1967,1966,1965,1964,1963,1962,1961
This statistics in other country:
Timeline:
This timeline shows a graph from 1961 to 2016 of European Union. No data until 1960. Number of actual observations by date: 56.
Source name:
World Development Indicators
Source organization:
Stockholm International Peace Research Institute (SIPRI), Arms Transfers Programme (http://portal.sipri.org/publications/pages/transfer/splash).
Categories, topics:
Public Sector, Trade
Last updated:
apr 23, 2017
Indicators value changes by year
Minimum:
2.519 bln
jan 1, 1962
Maximum:
11.448 bln
jan 1, 1982
At the date of observation
Value
Absolute change
Change from previous value
jan 1, 1961
3.474 bln
+3.474 bln
0.0%
jan 1, 1962
2.519 bln
-955.0 mln
-27.49%
jan 1, 1963
2.648 bln
+129.0 mln
5.12%
jan 1, 1964
3.121 bln
+473.0 mln
17.86%
jan 1, 1965
4.055 bln
+934.0 mln
29.93%
jan 1, 1966
3.667 bln
-388.0 mln
-9.57%
jan 1, 1967
4.505 bln
+838.0 mln
22.85%
jan 1, 1968
5.02 bln
+515.0 mln
11.43%
jan 1, 1969
4.624 bln
-396.0 mln
-7.89%
jan 1, 1970
4.808 bln
+184.0 mln
3.98%
jan 1, 1971
4.839 bln
+31.0 mln
0.64%
jan 1, 1972
7.356 bln
+2.517 bln
52.01%
jan 1, 1973
7.245 bln
-111.0 mln
-1.51%
jan 1, 1974
6.635 bln
-610.0 mln
-8.42%
jan 1, 1975
6.614 bln
-21.0 mln
-0.32%
jan 1, 1976
7.403 bln
+789.0 mln
11.93%
jan 1, 1977
7.477 bln
+74.0 mln
1.0%
jan 1, 1978
8.061 bln
+584.0 mln
7.81%
jan 1, 1979
8.651 bln
+590.0 mln
7.32%
jan 1, 1980
8.261 bln
-390.0 mln
-4.51%
jan 1, 1981
9.429 bln
+1.168 bln
14.14%
jan 1, 1982
11.448 bln
+2.019 bln
21.41%
jan 1, 1983
11.273 bln
-175.0 mln
-1.53%
jan 1, 1984
10.974 bln
-299.0 mln
-2.65%
jan 1, 1985
11.02 bln
+46.0 mln
0.42%
jan 1, 1986
9.464 bln
-1.556 bln
-14.12%
jan 1, 1987
8.0 bln
-1.464 bln
-15.47%
jan 1, 1988
8.287 bln
+287.0 mln
3.59%
jan 1, 1989
8.124 bln
-163.0 mln
-1.97%
jan 1, 1990
8.642 bln
+518.0 mln
6.38%
jan 1, 1991
6.573 bln
-2.069 bln
-23.94%
jan 1, 1992
6.348 bln
-225.0 mln
-3.42%
jan 1, 1993
4.766 bln
-1.582 bln
-24.92%
jan 1, 1994
5.596 bln
+830.0 mln
17.42%
jan 1, 1995
7.311 bln
+1.715 bln
30.65%
jan 1, 1996
5.591 bln
-1.72 bln
-23.53%
jan 1, 1997
7.18 bln
+1.589 bln
28.42%
jan 1, 1998
8.645 bln
+1.465 bln
20.4%
jan 1, 1999
8.109 bln
-536.0 mln
-6.2%
jan 1, 2000
6.917 bln
-1.192 bln
-14.7%
jan 1, 2001
5.518 bln
-1.399 bln
-20.23%
jan 1, 2002
5.414 bln
-104.0 mln
-1.88%
jan 1, 2003
4.739 bln
-675.0 mln
-12.47%
jan 1, 2004
5.492 bln
+753.0 mln
15.89%
jan 1, 2005
5.871 bln
+379.0 mln
6.9%
jan 1, 2006
7.445 bln
+1.574 bln
26.81%
jan 1, 2007
8.952 bln
+1.507 bln
20.24%
jan 1, 2008
9.95 bln
+998.0 mln
11.15%
jan 1, 2009
7.813 bln
-2.137 bln
-21.48%
jan 1, 2010
8.393 bln
+580.0 mln
7.42%
jan 1, 2011
6.806 bln
-1.587 bln
-18.91%
jan 1, 2012
7.973 bln
+1.167 bln
17.15%
jan 1, 2013
5.697 bln
-2.276 bln
-28.55%
jan 1, 2014
6.781 bln
+1.084 bln
19.03%
jan 1, 2015
8.185 bln
+1.404 bln
20.7%
jan 1, 2016
7.946 bln
-239.0 mln
-2.92%
Ranking of countries by current statistics by years


Comments: