29
/
en
AIzaSyAYiBZKx7MnpbEhh9jyipgxe19OcubqV5w
April 1, 2024
247302
Spain
ESP
true
2
1
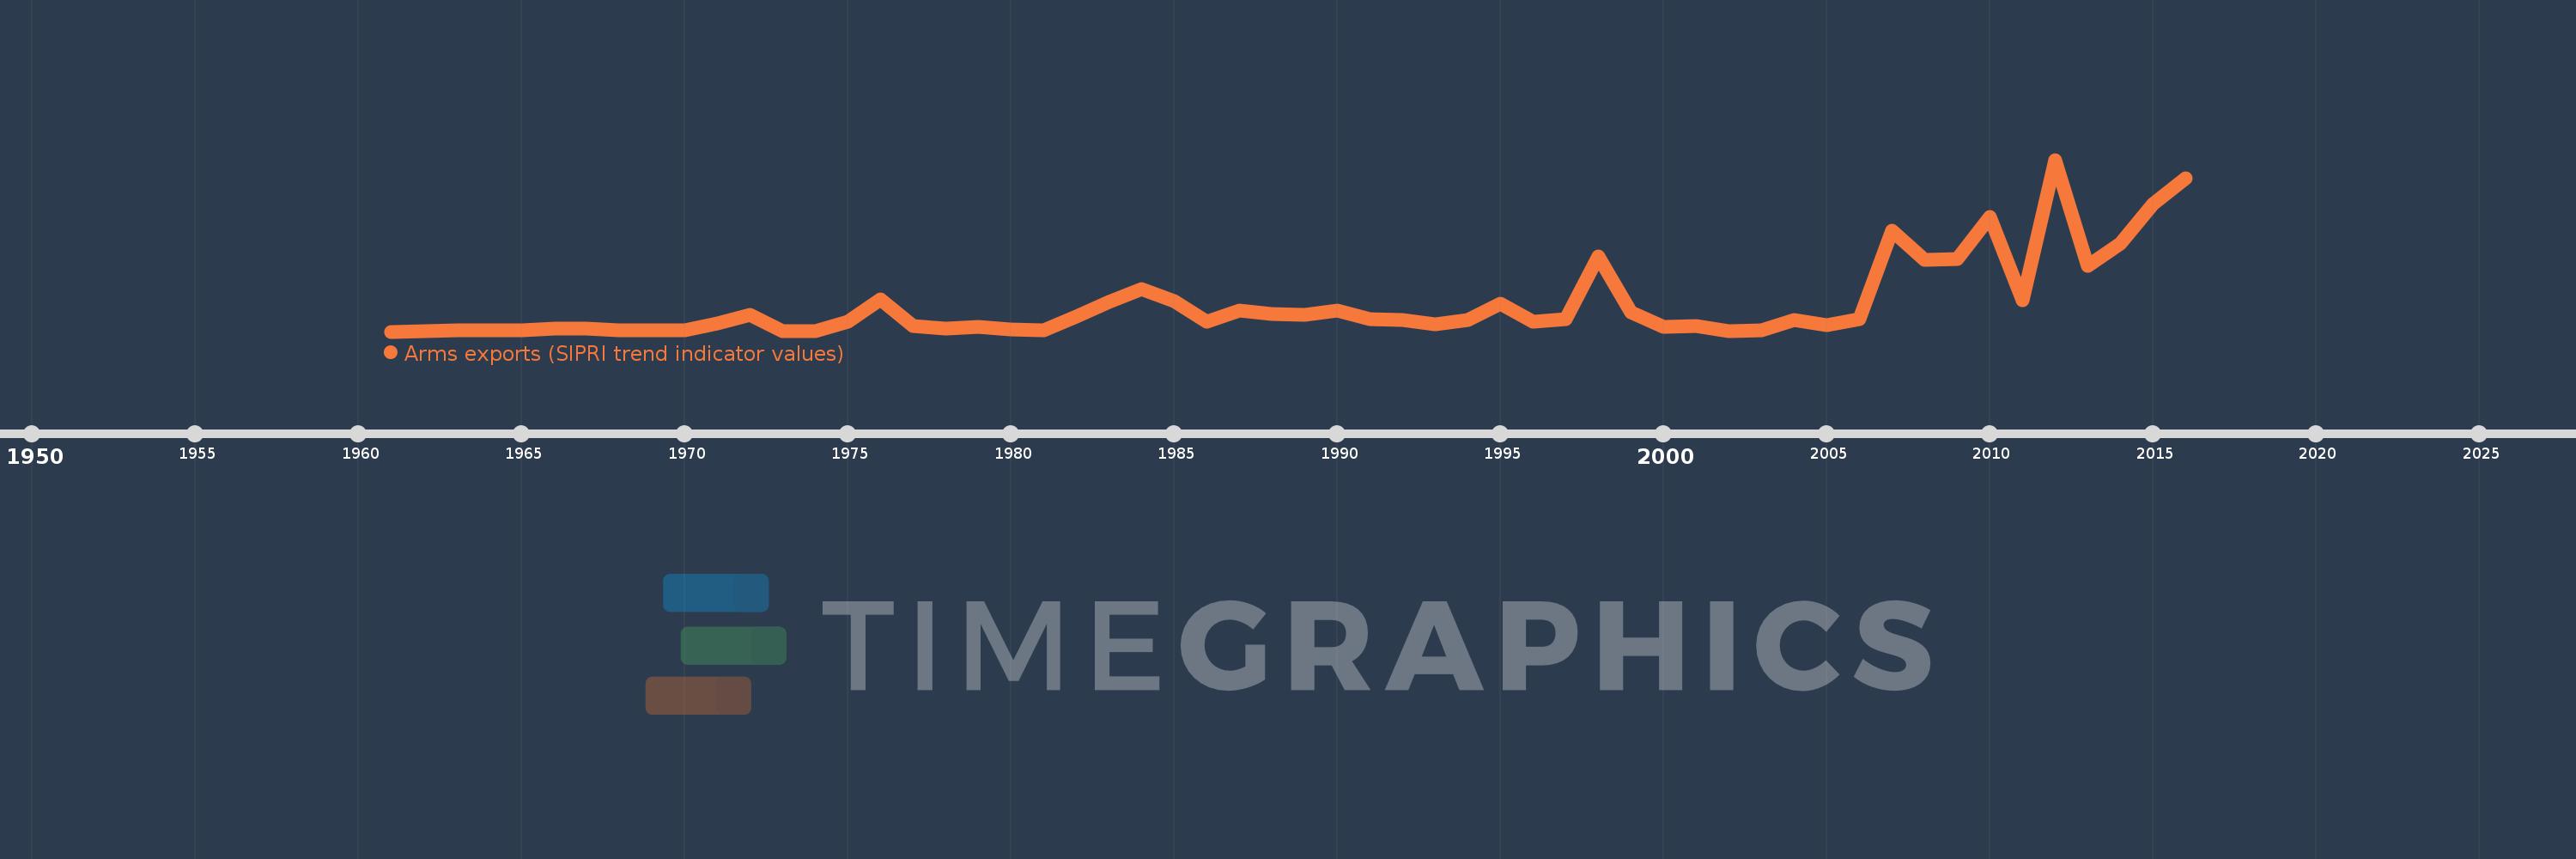
Arms exports (SIPRI trend indicator values)
2016,2015,2014,2013,2012,2011,2010,2009,2008,2007,2006,2005,2004,2003,2002,2001,2000,1999,1998,1997,1996,1995,1994,1993,1992,1991,1990,1989,1988,1987,1986,1985,1984,1983,1982,1981,1980,1979,1978,1977,1976,1975,1974,1973,1972,1971,1970,1969,1968,1967,1966,1965,1964,1963,1962,1961
This statistics in other country:
Timeline:
This timeline shows a graph from 1961 to 2016 of Spain. No data until 1960. Number of actual observations by date: 56.
Source name:
World Development Indicators
Source organization:
Stockholm International Peace Research Institute (SIPRI), Arms Transfers Programme (http://portal.sipri.org/publications/pages/transfer/splash).
Categories, topics:
Public Sector, Trade
Last updated:
apr 23, 2017
Indicators value changes by year
Minimum:
2.0 mln
jan 1, 1961
Maximum:
1.429 bln
jan 1, 2012
At the date of observation
Value
Absolute change
Change from previous value
jan 1, 1961
2.0 mln
+2.0 mln
0.0%
jan 1, 1962
8.0 mln
+6.0 mln
300.0%
jan 1, 1963
10.0 mln
+2.0 mln
25.0%
jan 1, 1964
10.0 mln
0.0
0.0%
jan 1, 1965
12.0 mln
+2.0 mln
20.0%
jan 1, 1966
26.0 mln
+14.0 mln
116.67%
jan 1, 1967
26.0 mln
0.0
0.0%
jan 1, 1968
12.0 mln
-14.0 mln
-53.85%
jan 1, 1969
12.0 mln
0.0
0.0%
jan 1, 1970
10.0 mln
-2.0 mln
-16.67%
jan 1, 1971
70.0 mln
+60.0 mln
600.0%
jan 1, 1972
140.0 mln
+70.0 mln
100.0%
jan 1, 1973
4.0 mln
-136.0 mln
-97.14%
jan 1, 1974
4.0 mln
0.0
0.0%
jan 1, 1975
84.0 mln
+80.0 mln
2.0K%
jan 1, 1976
267.0 mln
+183.0 mln
217.86%
jan 1, 1977
46.0 mln
-221.0 mln
-82.77%
jan 1, 1978
25.0 mln
-21.0 mln
-45.65%
jan 1, 1979
38.0 mln
+13.0 mln
52.0%
jan 1, 1980
18.0 mln
-20.0 mln
-52.63%
jan 1, 1981
10.0 mln
-8.0 mln
-44.44%
jan 1, 1982
130.0 mln
+120.0 mln
1.2K%
jan 1, 1983
251.0 mln
+121.0 mln
93.08%
jan 1, 1984
357.0 mln
+106.0 mln
42.23%
jan 1, 1985
252.0 mln
-105.0 mln
-29.41%
jan 1, 1986
85.0 mln
-167.0 mln
-66.27%
jan 1, 1987
177.0 mln
+92.0 mln
108.24%
jan 1, 1988
148.0 mln
-29.0 mln
-16.38%
jan 1, 1989
141.0 mln
-7.0 mln
-4.73%
jan 1, 1990
174.0 mln
+33.0 mln
23.4%
jan 1, 1991
108.0 mln
-66.0 mln
-37.93%
jan 1, 1992
100.0 mln
-8.0 mln
-7.41%
jan 1, 1993
65.0 mln
-35.0 mln
-35.0%
jan 1, 1994
98.0 mln
+33.0 mln
50.77%
jan 1, 1995
237.0 mln
+139.0 mln
141.84%
jan 1, 1996
82.0 mln
-155.0 mln
-65.4%
jan 1, 1997
105.0 mln
+23.0 mln
28.05%
jan 1, 1998
625.0 mln
+520.0 mln
495.24%
jan 1, 1999
162.0 mln
-463.0 mln
-74.08%
jan 1, 2000
43.0 mln
-119.0 mln
-73.46%
jan 1, 2001
46.0 mln
+3.0 mln
6.98%
jan 1, 2002
8.0 mln
-38.0 mln
-82.61%
jan 1, 2003
16.0 mln
+8.0 mln
100.0%
jan 1, 2004
95.0 mln
+79.0 mln
493.75%
jan 1, 2005
52.0 mln
-43.0 mln
-45.26%
jan 1, 2006
108.0 mln
+56.0 mln
107.69%
jan 1, 2007
840.0 mln
+732.0 mln
677.78%
jan 1, 2008
601.0 mln
-239.0 mln
-28.45%
jan 1, 2009
602.0 mln
+1000.0K
0.17%
jan 1, 2010
951.0 mln
+349.0 mln
57.97%
jan 1, 2011
263.0 mln
-688.0 mln
-72.34%
jan 1, 2012
1.429 bln
+1.166 bln
443.35%
jan 1, 2013
546.0 mln
-883.0 mln
-61.79%
jan 1, 2014
732.0 mln
+186.0 mln
34.07%
jan 1, 2015
1.062 bln
+330.0 mln
45.08%
jan 1, 2016
1.279 bln
+217.0 mln
20.43%
Ranking of countries by current statistics by years


Comments: