29
/
en
AIzaSyAYiBZKx7MnpbEhh9jyipgxe19OcubqV5w
April 1, 2024
124466
Egypt, Arab Rep.
EGY
true
2
1
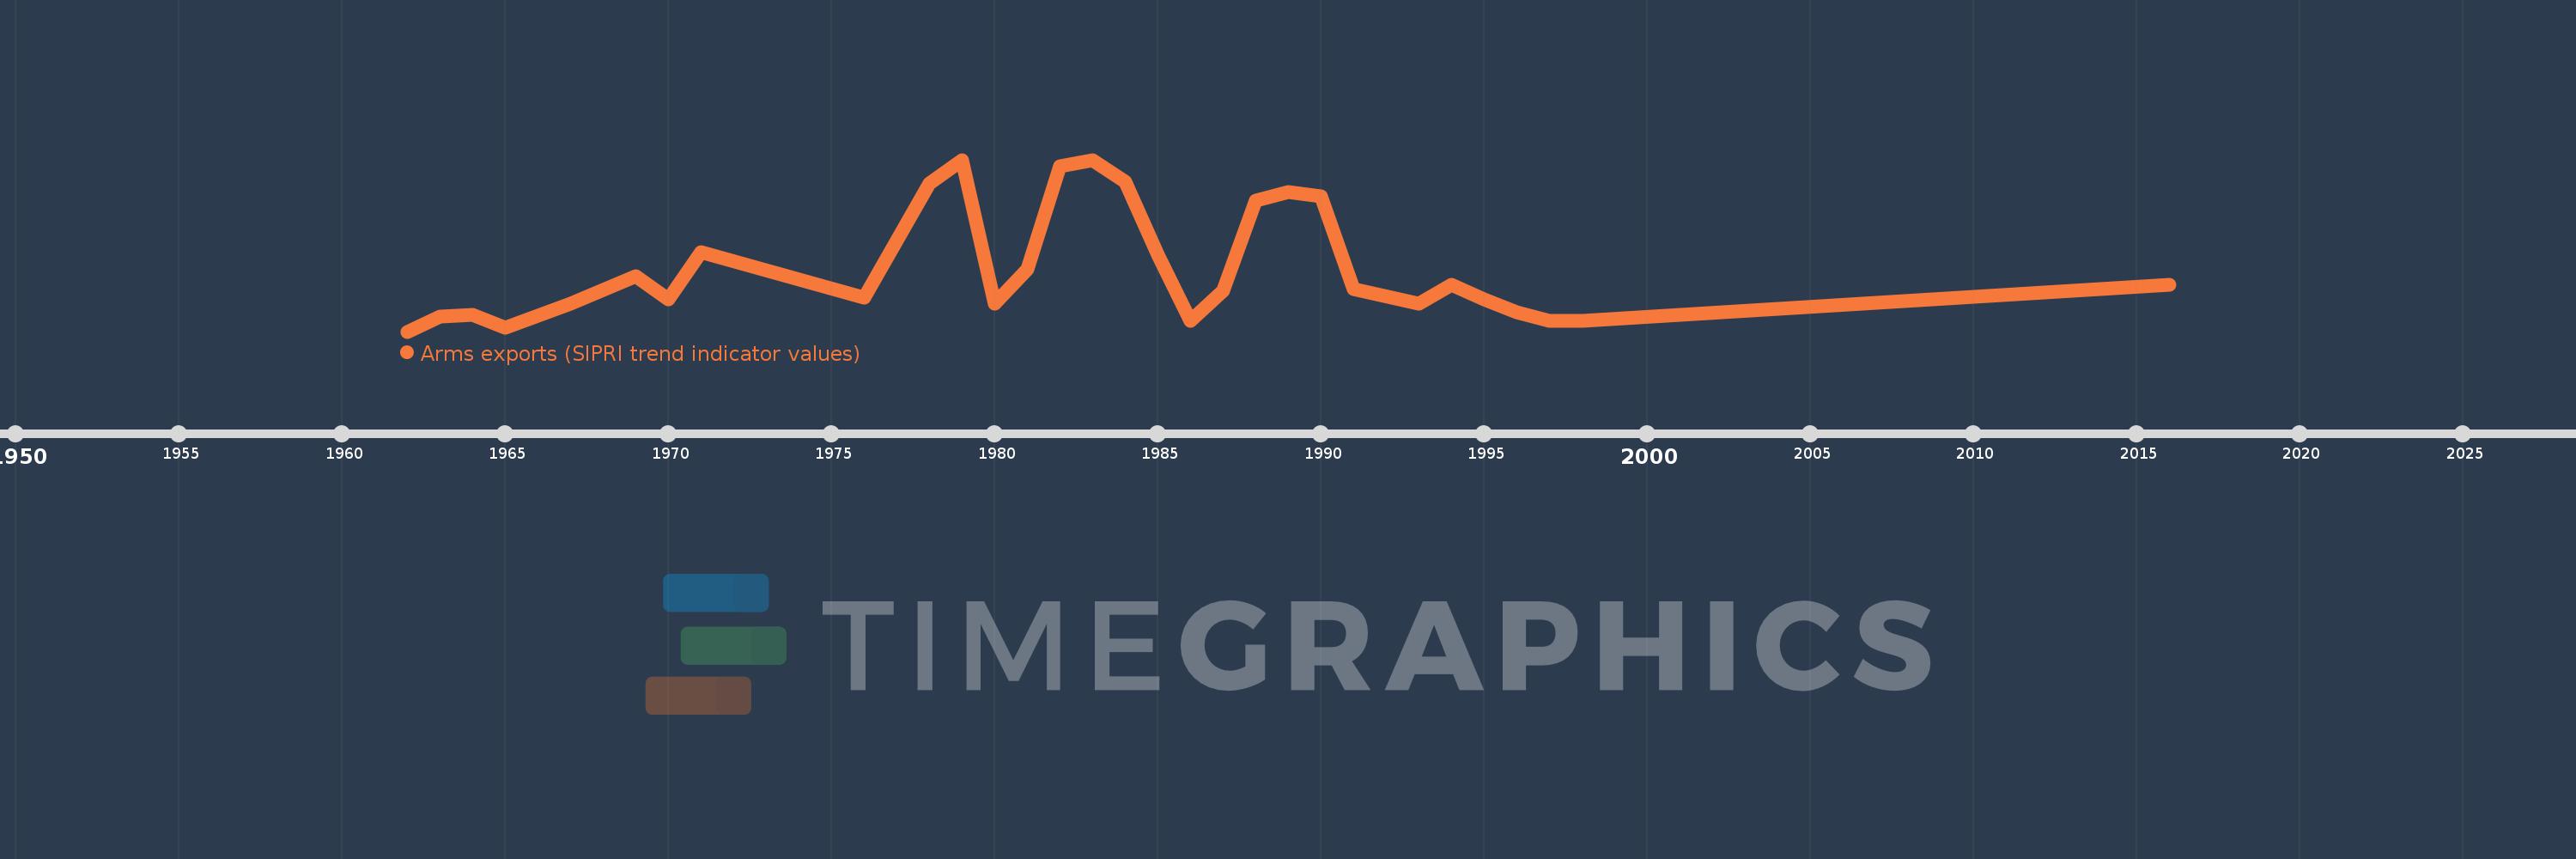
Arms exports (SIPRI trend indicator values)
2016,1998,1997,1996,1995,1994,1993,1991,1990,1989,1988,1987,1986,1985,1984,1983,1982,1981,1980,1979,1978,1976,1971,1970,1969,1967,1965,1964,1963,1962
This statistics in other country:
Timeline:
This timeline shows a graph from 1962 to 2016 of Egypt, Arab Rep.. No data until 1961. Number of actual observations by date: 30.
Source name:
World Development Indicators
Source organization:
Stockholm International Peace Research Institute (SIPRI), Arms Transfers Programme (http://portal.sipri.org/publications/pages/transfer/splash).
Categories, topics:
Public Sector, Trade
Last updated:
apr 23, 2017
Indicators value changes by year
Maximum:
80.0 mln
jan 1, 1979
At the date of observation
Value
Absolute change
Change from previous value
jan 1, 1963
7.0 mln
+7.0 mln
%
jan 1, 1964
8.0 mln
+1000.0K
14.29%
jan 1, 1965
2.0 mln
-6.0 mln
-75.0%
jan 1, 1967
13.0 mln
+11.0 mln
550.0%
jan 1, 1969
26.0 mln
+13.0 mln
100.0%
jan 1, 1970
15.0 mln
-11.0 mln
-42.31%
jan 1, 1971
37.0 mln
+22.0 mln
146.67%
jan 1, 1976
16.0 mln
-21.0 mln
-56.76%
jan 1, 1978
69.0 mln
+53.0 mln
331.25%
jan 1, 1979
80.0 mln
+11.0 mln
15.94%
jan 1, 1980
13.0 mln
-67.0 mln
-83.75%
jan 1, 1981
29.0 mln
+16.0 mln
123.08%
jan 1, 1982
77.0 mln
+48.0 mln
165.52%
jan 1, 1983
80.0 mln
+3.0 mln
3.9%
jan 1, 1984
70.0 mln
-10.0 mln
-12.5%
jan 1, 1985
36.0 mln
-34.0 mln
-48.57%
jan 1, 1986
5.0 mln
-31.0 mln
-86.11%
jan 1, 1987
19.0 mln
+14.0 mln
280.0%
jan 1, 1988
61.0 mln
+42.0 mln
221.05%
jan 1, 1989
65.0 mln
+4.0 mln
6.56%
jan 1, 1990
63.0 mln
-2.0 mln
-3.08%
jan 1, 1991
20.0 mln
-43.0 mln
-68.25%
jan 1, 1993
13.0 mln
-7.0 mln
-35.0%
jan 1, 1994
22.0 mln
+9.0 mln
69.23%
jan 1, 1995
15.0 mln
-7.0 mln
-31.82%
jan 1, 1996
9.0 mln
-6.0 mln
-40.0%
jan 1, 1997
5.0 mln
-4.0 mln
-44.44%
jan 1, 1998
5.0 mln
0.0
0.0%
jan 1, 2016
22.0 mln
+17.0 mln
340.0%
Ranking of countries by current statistics by years


Comments: