29
/
en
AIzaSyAYiBZKx7MnpbEhh9jyipgxe19OcubqV5w
April 1, 2024
164487
Jordan
JOR
true
2
1
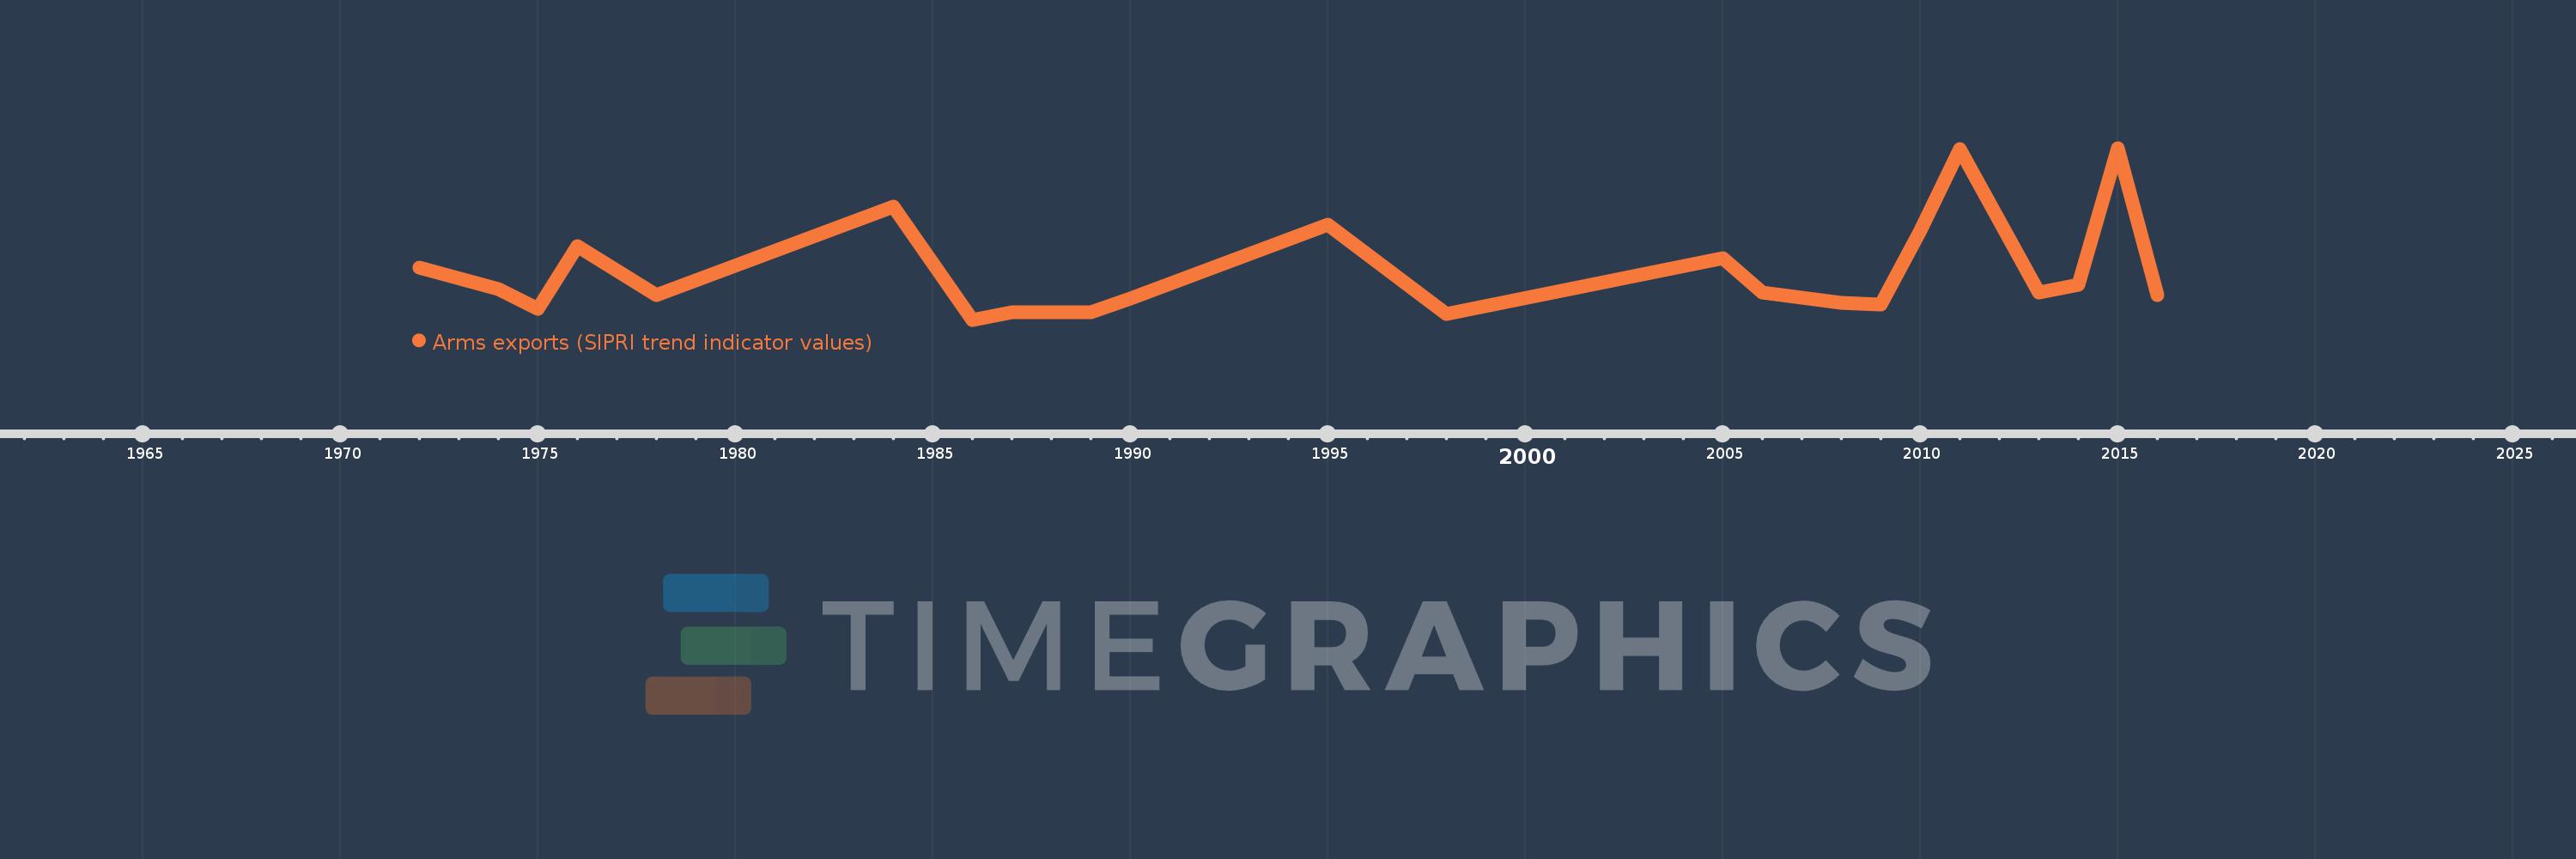
Arms exports (SIPRI trend indicator values)
2016,2015,2014,2013,2011,2010,2009,2008,2006,2005,1998,1995,1990,1989,1987,1986,1984,1978,1976,1975,1974,1972
This statistics in other country:
Timeline:
This timeline shows a graph from 1972 to 2016 of Jordan. No data until 1971. Number of actual observations by date: 22.
Source name:
World Development Indicators
Source organization:
Stockholm International Peace Research Institute (SIPRI), Arms Transfers Programme (http://portal.sipri.org/publications/pages/transfer/splash).
Categories, topics:
Public Sector, Trade
Last updated:
apr 23, 2017
Indicators value changes by year
Minimum:
2.0 mln
jan 1, 1986
Maximum:
114.0 mln
jan 1, 2015
At the date of observation
Value
Absolute change
Change from previous value
jan 1, 1972
36.0 mln
+36.0 mln
0.0%
jan 1, 1974
22.0 mln
-14.0 mln
-38.89%
jan 1, 1975
9.0 mln
-13.0 mln
-59.09%
jan 1, 1976
50.0 mln
+41.0 mln
455.56%
jan 1, 1978
18.0 mln
-32.0 mln
-64.0%
jan 1, 1984
76.0 mln
+58.0 mln
322.22%
jan 1, 1986
2.0 mln
-74.0 mln
-97.37%
jan 1, 1987
7.0 mln
+5.0 mln
250.0%
jan 1, 1989
7.0 mln
0.0
0.0%
jan 1, 1990
16.0 mln
+9.0 mln
128.57%
jan 1, 1995
64.0 mln
+48.0 mln
300.0%
jan 1, 1998
6.0 mln
-58.0 mln
-90.63%
jan 1, 2005
42.0 mln
+36.0 mln
600.0%
jan 1, 2006
20.0 mln
-22.0 mln
-52.38%
jan 1, 2008
13.0 mln
-7.0 mln
-35.0%
jan 1, 2009
12.0 mln
-1000.0K
-7.69%
jan 1, 2010
60.0 mln
+48.0 mln
400.0%
jan 1, 2011
113.0 mln
+53.0 mln
88.33%
jan 1, 2013
20.0 mln
-93.0 mln
-82.3%
jan 1, 2014
25.0 mln
+5.0 mln
25.0%
jan 1, 2015
114.0 mln
+89.0 mln
356.0%
jan 1, 2016
18.0 mln
-96.0 mln
-84.21%
Ranking of countries by current statistics by years


Comments: