29
/
en
AIzaSyAYiBZKx7MnpbEhh9jyipgxe19OcubqV5w
April 1, 2024
48507
Middle East & North Africa
MEA
false
2
1
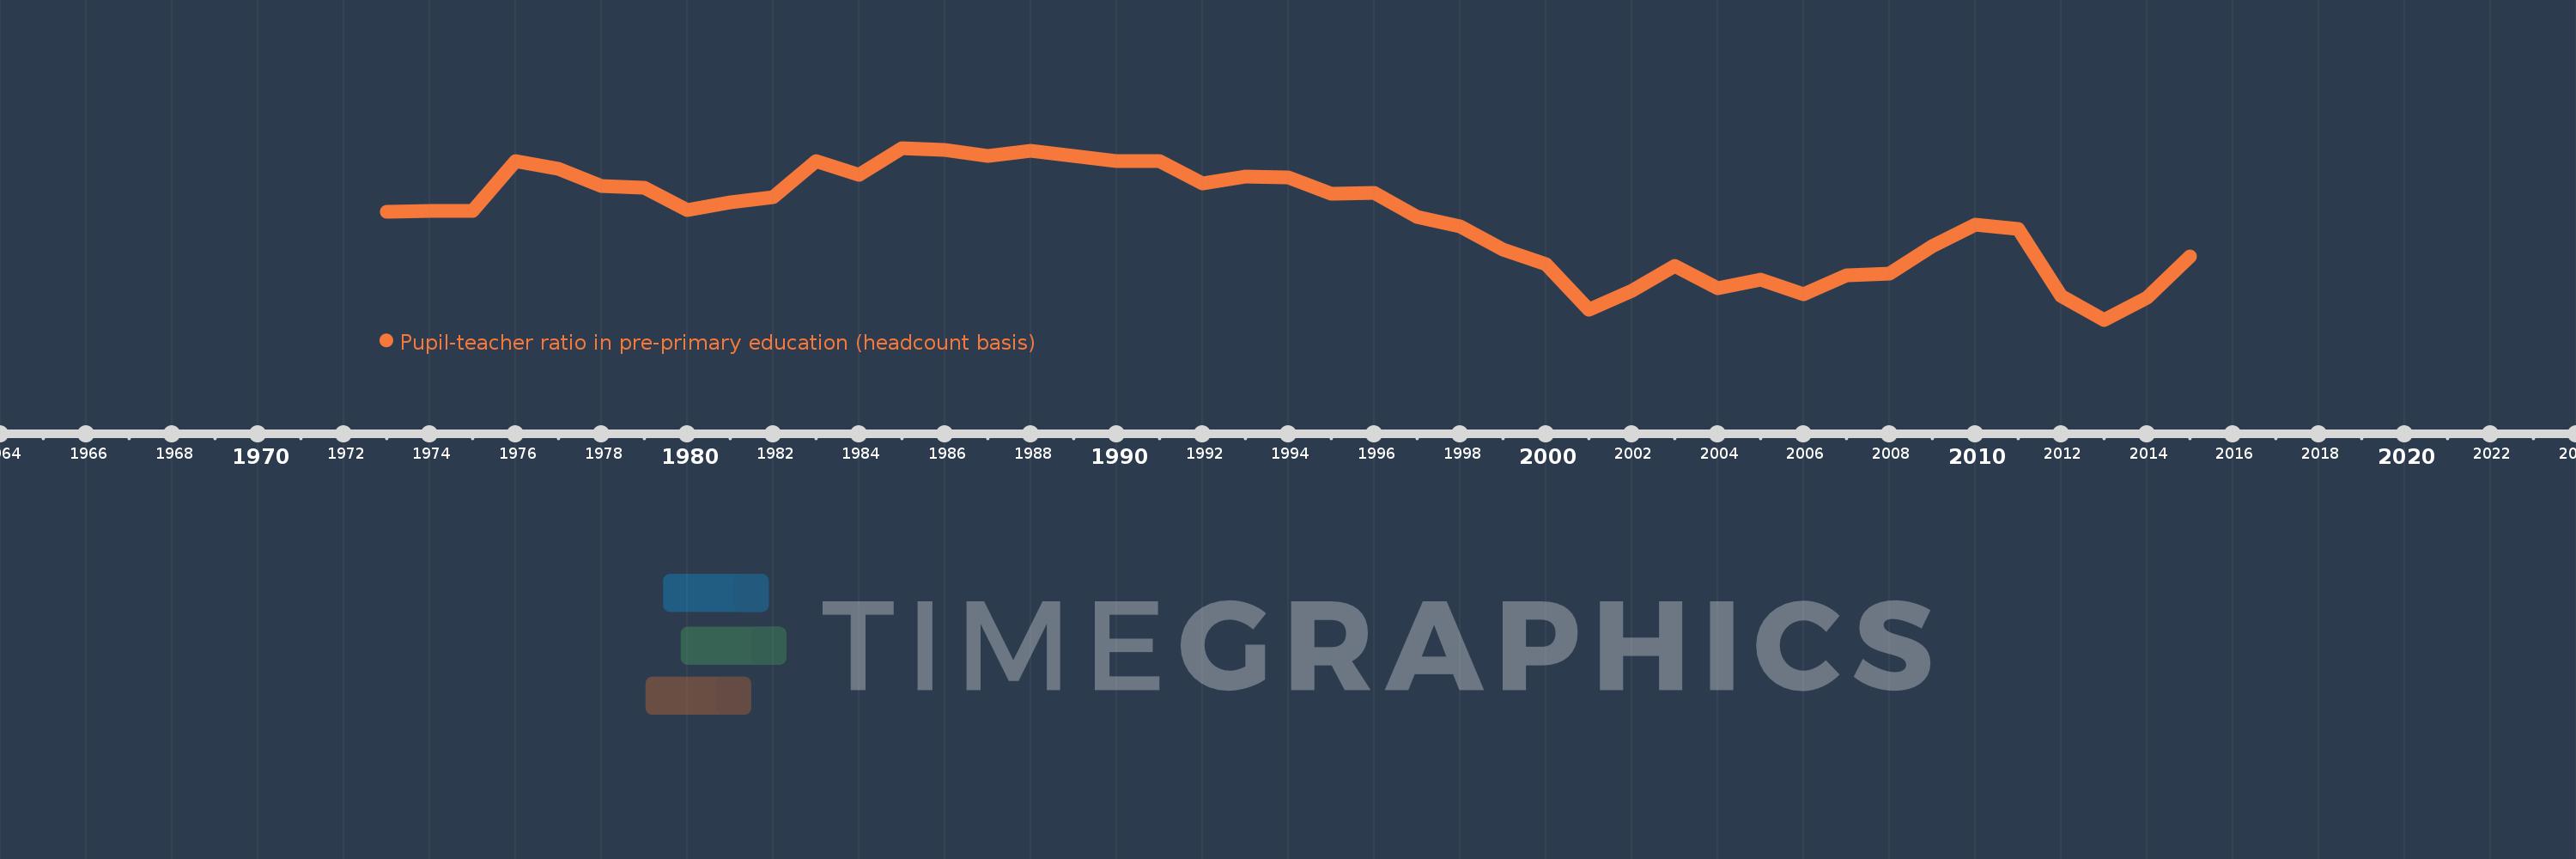
Pupil-teacher ratio in pre-primary education (headcount basis)
2015,2014,2013,2012,2011,2010,2009,2008,2007,2006,2005,2004,2003,2002,2001,2000,1999,1998,1997,1996,1995,1994,1993,1992,1991,1990,1989,1988,1987,1986,1985,1984,1983,1982,1981,1980,1979,1978,1977,1976,1975,1974,1973
This statistics in other country:
AfghanistanAlbaniaAlgeriaAndorraAngolaAntigua and BarbudaArab WorldArgentinaArmeniaArubaAustriaAzerbaijanBahamas, TheBahrainBangladeshBarbadosBelarusBelgiumBelizeBeninBermudaBhutanBoliviaBosnia and HerzegovinaBotswanaBrazilBritish Virgin IslandsBrunei DarussalamBulgariaBurkina FasoBurundiCabo VerdeCambodiaCameroonCanadaCaribbean small statesCayman IslandsCentral African RepublicCentral Europe and the BalticsChadChileChinaColombiaComorosCongo, Dem. Rep.Congo, Rep.Costa RicaCote d'IvoireCroatiaCubaCyprusCzech RepublicDenmarkDjiboutiDominicaDominican RepublicEarly-demographic dividendEast Asia & PacificEast Asia & Pacific (excluding high income)East Asia & Pacific (IDA & IBRD countries)EcuadorEgypt, Arab Rep.El SalvadorEquatorial GuineaEritreaEstoniaEthiopiaEuro areaEurope & Central AsiaEurope & Central Asia (excluding high income)Europe & Central Asia (IDA & IBRD countries)European UnionFijiFinlandFragile and conflict affected situationsFranceGabonGambia, TheGeorgiaGermanyGhanaGibraltarGreeceGrenadaGuatemalaGuineaGuinea-BissauGuyanaHaitiHeavily indebted poor countries (HIPC)High incomeHondurasHong Kong SAR, ChinaHungaryIBRD onlyIcelandIDA & IBRD totalIDA blendIDA onlyIDA totalIndiaIndonesiaIran, Islamic Rep.IraqIrelandIsraelItalyJamaicaJapanJordanKazakhstanKenyaKorea, Dem. People’s Rep.Korea, Rep.KuwaitKyrgyz RepublicLao PDRLate-demographic dividendLatin America & Caribbean Latin America & Caribbean (excluding high income)Latin America & the Caribbean (IDA & IBRD countries)LatviaLeast developed countries: UN classificationLebanonLesothoLiberiaLibyaLiechtensteinLithuaniaLow & middle incomeLow incomeLower middle incomeLuxembourgMacao SAR, ChinaMacedonia, FYRMadagascarMalaysiaMaldivesMaliMaltaMarshall IslandsMauritaniaMauritiusMexicoMiddle East & North AfricaMiddle East & North Africa (excluding high income)Middle East & North Africa (IDA & IBRD countries)Middle incomeMoldovaMonacoMongoliaMontenegroMoroccoMozambiqueMyanmarNamibiaNauruNepalNetherlandsNew ZealandNicaraguaNigerNigeriaNorth AmericaNorwayOECD membersOmanOther small statesPacific island small statesPalauPanamaPapua New GuineaParaguayPeruPhilippinesPolandPortugalPost-demographic dividendPre-demographic dividendPuerto RicoQatarRomaniaRussian FederationRwandaSamoaSan MarinoSao Tome and PrincipeSaudi ArabiaSenegalSerbiaSeychellesSierra LeoneSingaporeSlovak RepublicSloveniaSmall statesSolomon IslandsSomaliaSouth AfricaSouth AsiaSouth Asia (IDA & IBRD)South SudanSpainSt. Kitts and NevisSt. LuciaSt. Vincent and the GrenadinesSub-Saharan Africa Sub-Saharan Africa (excluding high income)Sub-Saharan Africa (IDA & IBRD countries)SudanSurinameSwazilandSwedenSwitzerlandSyrian Arab RepublicTajikistanTanzaniaThailandTimor-LesteTogoTongaTrinidad and TobagoTunisiaTurkeyTurks and Caicos IslandsTuvaluUgandaUkraineUnited Arab EmiratesUnited KingdomUnited StatesUpper middle incomeUruguayUzbekistanVanuatuVenezuela, RBVietnamWest Bank and GazaWorldYemen, Rep.Zimbabwe Timeline:
This timeline shows a graph from 1973 to 2015 of Middle East & North Africa. No data until 1972. Number of actual observations by date: 43.
Source name:
World Development Indicators
Source organization:
UNESCO Institute for Statistics
Categories, topics:
Education
Last updated:
apr 23, 2017
Indicators value changes by year
Minimum:
18.887
jan 1, 2013
Maximum:
23.408
jan 1, 1985
At the date of observation
Value
Absolute change
Change from previous value
jan 1, 1973
21.734
+21.734
0.0%
jan 1, 1974
21.758
+0.024
0.11%
jan 1, 1975
21.758
-0.001
0.0%
jan 1, 1976
23.069
+1.311
6.03%
jan 1, 1977
22.851
-0.217
-0.94%
jan 1, 1978
22.401
-0.45
-1.97%
jan 1, 1979
22.369
-0.032
-0.14%
jan 1, 1980
21.766
-0.603
-2.7%
jan 1, 1981
21.967
+0.201
0.92%
jan 1, 1982
22.11
+0.144
0.65%
jan 1, 1983
23.054
+0.943
4.27%
jan 1, 1984
22.711
-0.343
-1.49%
jan 1, 1985
23.408
+0.697
3.07%
jan 1, 1986
23.354
-0.054
-0.23%
jan 1, 1987
23.194
-0.16
-0.68%
jan 1, 1988
23.338
+0.144
0.62%
jan 1, 1989
23.202
-0.136
-0.58%
jan 1, 1990
23.067
-0.135
-0.58%
jan 1, 1991
23.071
+0.004
0.02%
jan 1, 1992
22.471
-0.6
-2.6%
jan 1, 1993
22.662
+0.19
0.85%
jan 1, 1994
22.64
-0.022
-0.1%
jan 1, 1995
22.205
-0.435
-1.92%
jan 1, 1996
22.232
+0.027
0.12%
jan 1, 1997
21.603
-0.628
-2.83%
jan 1, 1998
21.342
-0.261
-1.21%
jan 1, 1999
20.727
-0.616
-2.89%
jan 1, 2000
20.358
-0.369
-1.78%
jan 1, 2001
19.162
-1.196
-5.87%
jan 1, 2002
19.653
+0.491
2.56%
jan 1, 2003
20.306
+0.653
3.32%
jan 1, 2004
19.727
-0.579
-2.85%
jan 1, 2005
19.941
+0.214
1.08%
jan 1, 2006
19.558
-0.383
-1.92%
jan 1, 2007
20.063
+0.505
2.58%
jan 1, 2008
20.09
+0.028
0.14%
jan 1, 2009
20.813
+0.723
3.6%
jan 1, 2010
21.389
+0.576
2.77%
jan 1, 2011
21.28
-0.109
-0.51%
jan 1, 2012
19.521
-1.759
-8.26%
jan 1, 2013
18.887
-0.635
-3.25%
jan 1, 2014
19.473
+0.586
3.1%
jan 1, 2015
20.555
+1.082
5.56%
Ranking of countries by current statistics by years


Comments: