29
/
en
AIzaSyAYiBZKx7MnpbEhh9jyipgxe19OcubqV5w
April 1, 2024
74328
Austria
AUT
true
2
1
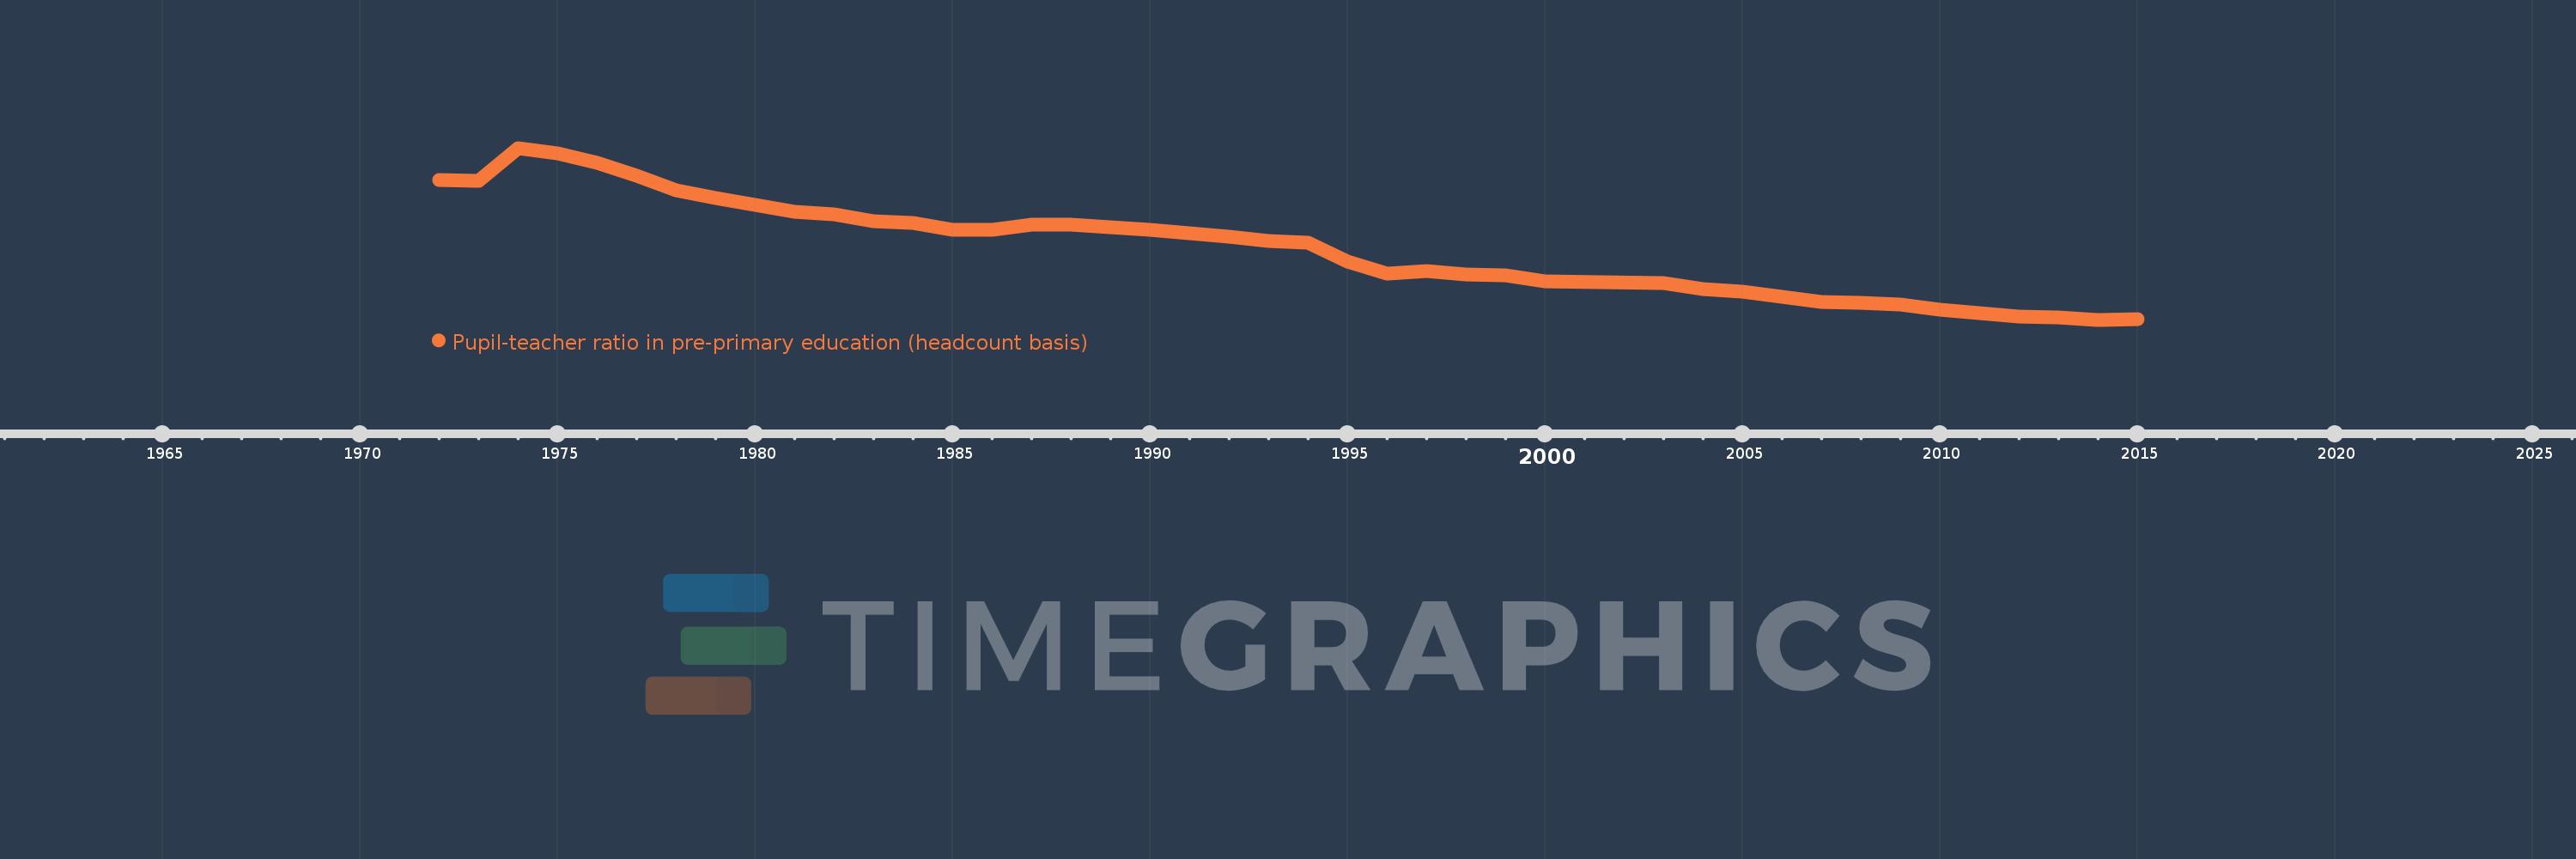
Pupil-teacher ratio in pre-primary education (headcount basis)
2015,2014,2013,2012,2011,2010,2009,2008,2007,2006,2005,2004,2003,2000,1999,1998,1997,1996,1995,1994,1993,1992,1991,1990,1989,1988,1987,1986,1985,1984,1983,1982,1981,1980,1979,1978,1977,1976,1975,1974,1973,1972
This statistics in other country:
AfghanistanAlbaniaAlgeriaAndorraAngolaAntigua and BarbudaArab WorldArgentinaArmeniaArubaAustriaAzerbaijanBahamas, TheBahrainBangladeshBarbadosBelarusBelgiumBelizeBeninBermudaBhutanBoliviaBosnia and HerzegovinaBotswanaBrazilBritish Virgin IslandsBrunei DarussalamBulgariaBurkina FasoBurundiCabo VerdeCambodiaCameroonCanadaCaribbean small statesCayman IslandsCentral African RepublicCentral Europe and the BalticsChadChileChinaColombiaComorosCongo, Dem. Rep.Congo, Rep.Costa RicaCote d'IvoireCroatiaCubaCyprusCzech RepublicDenmarkDjiboutiDominicaDominican RepublicEarly-demographic dividendEast Asia & PacificEast Asia & Pacific (excluding high income)East Asia & Pacific (IDA & IBRD countries)EcuadorEgypt, Arab Rep.El SalvadorEquatorial GuineaEritreaEstoniaEthiopiaEuro areaEurope & Central AsiaEurope & Central Asia (excluding high income)Europe & Central Asia (IDA & IBRD countries)European UnionFijiFinlandFragile and conflict affected situationsFranceGabonGambia, TheGeorgiaGermanyGhanaGibraltarGreeceGrenadaGuatemalaGuineaGuinea-BissauGuyanaHaitiHeavily indebted poor countries (HIPC)High incomeHondurasHong Kong SAR, ChinaHungaryIBRD onlyIcelandIDA & IBRD totalIDA blendIDA onlyIDA totalIndiaIndonesiaIran, Islamic Rep.IraqIrelandIsraelItalyJamaicaJapanJordanKazakhstanKenyaKorea, Dem. People’s Rep.Korea, Rep.KuwaitKyrgyz RepublicLao PDRLate-demographic dividendLatin America & Caribbean Latin America & Caribbean (excluding high income)Latin America & the Caribbean (IDA & IBRD countries)LatviaLeast developed countries: UN classificationLebanonLesothoLiberiaLibyaLiechtensteinLithuaniaLow & middle incomeLow incomeLower middle incomeLuxembourgMacao SAR, ChinaMacedonia, FYRMadagascarMalaysiaMaldivesMaliMaltaMarshall IslandsMauritaniaMauritiusMexicoMiddle East & North AfricaMiddle East & North Africa (excluding high income)Middle East & North Africa (IDA & IBRD countries)Middle incomeMoldovaMonacoMongoliaMontenegroMoroccoMozambiqueMyanmarNamibiaNauruNepalNetherlandsNew ZealandNicaraguaNigerNigeriaNorth AmericaNorwayOECD membersOmanOther small statesPacific island small statesPalauPanamaPapua New GuineaParaguayPeruPhilippinesPolandPortugalPost-demographic dividendPre-demographic dividendPuerto RicoQatarRomaniaRussian FederationRwandaSamoaSan MarinoSao Tome and PrincipeSaudi ArabiaSenegalSerbiaSeychellesSierra LeoneSingaporeSlovak RepublicSloveniaSmall statesSolomon IslandsSomaliaSouth AfricaSouth AsiaSouth Asia (IDA & IBRD)South SudanSpainSt. Kitts and NevisSt. LuciaSt. Vincent and the GrenadinesSub-Saharan Africa Sub-Saharan Africa (excluding high income)Sub-Saharan Africa (IDA & IBRD countries)SudanSurinameSwazilandSwedenSwitzerlandSyrian Arab RepublicTajikistanTanzaniaThailandTimor-LesteTogoTongaTrinidad and TobagoTunisiaTurkeyTurks and Caicos IslandsTuvaluUgandaUkraineUnited Arab EmiratesUnited KingdomUnited StatesUpper middle incomeUruguayUzbekistanVanuatuVenezuela, RBVietnamWest Bank and GazaWorldYemen, Rep.Zimbabwe Timeline:
This timeline shows a graph from 1972 to 2015 of Austria. No data until 1971. Number of actual observations by date: 42.
Source name:
World Development Indicators
Source organization:
UNESCO Institute for Statistics
Categories, topics:
Education
Last updated:
apr 23, 2017
Indicators value changes by year
Minimum:
11.678
jan 1, 2014
Maximum:
30.795
jan 1, 1974
At the date of observation
Value
Absolute change
Change from previous value
jan 1, 1972
27.212
+27.212
0.0%
jan 1, 1973
27.13
-0.082
-0.3%
jan 1, 1974
30.795
+3.666
13.51%
jan 1, 1975
30.189
-0.607
-1.97%
jan 1, 1976
29.16
-1.029
-3.41%
jan 1, 1977
27.665
-1.495
-5.13%
jan 1, 1978
26.094
-1.571
-5.68%
jan 1, 1979
25.182
-0.912
-3.5%
jan 1, 1980
24.427
-0.755
-3.0%
jan 1, 1981
23.704
-0.723
-2.96%
jan 1, 1982
23.428
-0.277
-1.17%
jan 1, 1983
22.653
-0.775
-3.31%
jan 1, 1984
22.433
-0.22
-0.97%
jan 1, 1985
21.66
-0.773
-3.44%
jan 1, 1986
21.645
-0.015
-0.07%
jan 1, 1987
22.255
+0.611
2.82%
jan 1, 1988
22.232
-0.023
-0.11%
jan 1, 1989
21.998
-0.234
-1.05%
jan 1, 1990
21.707
-0.292
-1.33%
jan 1, 1991
21.334
-0.372
-1.72%
jan 1, 1992
20.884
-0.45
-2.11%
jan 1, 1993
20.468
-0.417
-1.99%
jan 1, 1994
20.268
-0.2
-0.98%
jan 1, 1995
18.182
-2.086
-10.29%
jan 1, 1996
16.789
-1.392
-7.66%
jan 1, 1997
17.071
+0.282
1.68%
jan 1, 1998
16.757
-0.313
-1.84%
jan 1, 1999
16.639
-0.119
-0.71%
jan 1, 2000
15.964
-0.675
-4.05%
jan 1, 2003
15.801
-0.163
-1.02%
jan 1, 2004
15.125
-0.676
-4.28%
jan 1, 2005
14.828
-0.297
-1.97%
jan 1, 2006
14.207
-0.62
-4.18%
jan 1, 2007
13.639
-0.569
-4.0%
jan 1, 2008
13.533
-0.106
-0.77%
jan 1, 2009
13.394
-0.139
-1.03%
jan 1, 2010
12.78
-0.614
-4.59%
jan 1, 2011
12.413
-0.366
-2.87%
jan 1, 2012
12.015
-0.398
-3.2%
jan 1, 2013
11.917
-0.098
-0.82%
jan 1, 2014
11.678
-0.239
-2.0%
jan 1, 2015
11.738
+0.059
0.51%
Ranking of countries by current statistics by years


Comments: