29
/
en
AIzaSyAYiBZKx7MnpbEhh9jyipgxe19OcubqV5w
April 1, 2024
121470
Dominica
DMA
true
2
1
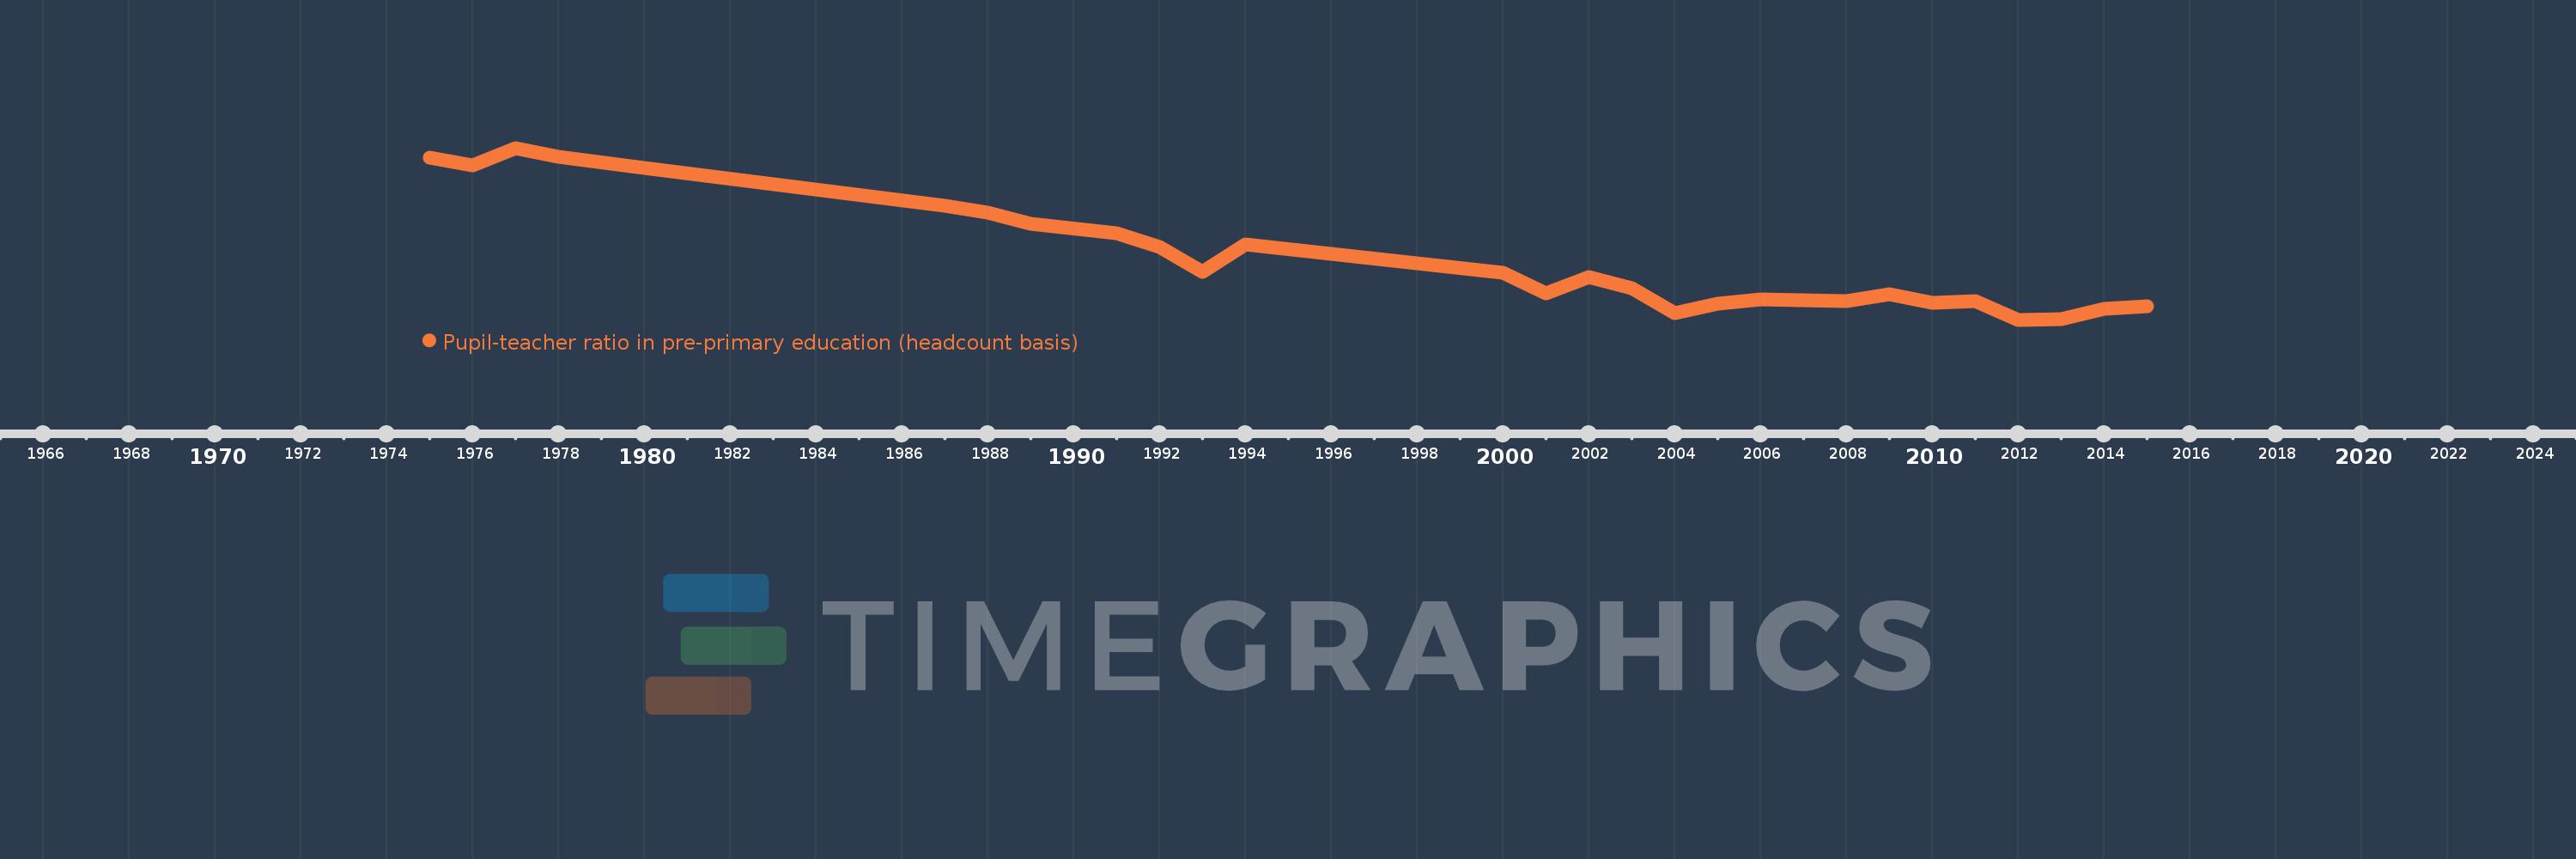
Pupil-teacher ratio in pre-primary education (headcount basis)
2015,2014,2013,2012,2011,2010,2009,2008,2007,2006,2005,2004,2003,2002,2001,2000,1994,1993,1992,1991,1989,1988,1987,1980,1978,1977,1976,1975
This statistics in other country:
AfghanistanAlbaniaAlgeriaAndorraAngolaAntigua and BarbudaArab WorldArgentinaArmeniaArubaAustriaAzerbaijanBahamas, TheBahrainBangladeshBarbadosBelarusBelgiumBelizeBeninBermudaBhutanBoliviaBosnia and HerzegovinaBotswanaBrazilBritish Virgin IslandsBrunei DarussalamBulgariaBurkina FasoBurundiCabo VerdeCambodiaCameroonCanadaCaribbean small statesCayman IslandsCentral African RepublicCentral Europe and the BalticsChadChileChinaColombiaComorosCongo, Dem. Rep.Congo, Rep.Costa RicaCote d'IvoireCroatiaCubaCyprusCzech RepublicDenmarkDjiboutiDominicaDominican RepublicEarly-demographic dividendEast Asia & PacificEast Asia & Pacific (excluding high income)East Asia & Pacific (IDA & IBRD countries)EcuadorEgypt, Arab Rep.El SalvadorEquatorial GuineaEritreaEstoniaEthiopiaEuro areaEurope & Central AsiaEurope & Central Asia (excluding high income)Europe & Central Asia (IDA & IBRD countries)European UnionFijiFinlandFragile and conflict affected situationsFranceGabonGambia, TheGeorgiaGermanyGhanaGibraltarGreeceGrenadaGuatemalaGuineaGuinea-BissauGuyanaHaitiHeavily indebted poor countries (HIPC)High incomeHondurasHong Kong SAR, ChinaHungaryIBRD onlyIcelandIDA & IBRD totalIDA blendIDA onlyIDA totalIndiaIndonesiaIran, Islamic Rep.IraqIrelandIsraelItalyJamaicaJapanJordanKazakhstanKenyaKorea, Dem. People’s Rep.Korea, Rep.KuwaitKyrgyz RepublicLao PDRLate-demographic dividendLatin America & Caribbean Latin America & Caribbean (excluding high income)Latin America & the Caribbean (IDA & IBRD countries)LatviaLeast developed countries: UN classificationLebanonLesothoLiberiaLibyaLiechtensteinLithuaniaLow & middle incomeLow incomeLower middle incomeLuxembourgMacao SAR, ChinaMacedonia, FYRMadagascarMalaysiaMaldivesMaliMaltaMarshall IslandsMauritaniaMauritiusMexicoMiddle East & North AfricaMiddle East & North Africa (excluding high income)Middle East & North Africa (IDA & IBRD countries)Middle incomeMoldovaMonacoMongoliaMontenegroMoroccoMozambiqueMyanmarNamibiaNauruNepalNetherlandsNew ZealandNicaraguaNigerNigeriaNorth AmericaNorwayOECD membersOmanOther small statesPacific island small statesPalauPanamaPapua New GuineaParaguayPeruPhilippinesPolandPortugalPost-demographic dividendPre-demographic dividendPuerto RicoQatarRomaniaRussian FederationRwandaSamoaSan MarinoSao Tome and PrincipeSaudi ArabiaSenegalSerbiaSeychellesSierra LeoneSingaporeSlovak RepublicSloveniaSmall statesSolomon IslandsSomaliaSouth AfricaSouth AsiaSouth Asia (IDA & IBRD)South SudanSpainSt. Kitts and NevisSt. LuciaSt. Vincent and the GrenadinesSub-Saharan Africa Sub-Saharan Africa (excluding high income)Sub-Saharan Africa (IDA & IBRD countries)SudanSurinameSwazilandSwedenSwitzerlandSyrian Arab RepublicTajikistanTanzaniaThailandTimor-LesteTogoTongaTrinidad and TobagoTunisiaTurkeyTurks and Caicos IslandsTuvaluUgandaUkraineUnited Arab EmiratesUnited KingdomUnited StatesUpper middle incomeUruguayUzbekistanVanuatuVenezuela, RBVietnamWest Bank and GazaWorldYemen, Rep.Zimbabwe Timeline:
This timeline shows a graph from 1975 to 2015 of Dominica. No data until 1974. Number of actual observations by date: 28.
Source name:
World Development Indicators
Source organization:
UNESCO Institute for Statistics
Categories, topics:
Education
Last updated:
apr 23, 2017
Indicators value changes by year
Minimum:
10.793
jan 1, 2012
Maximum:
38.333
jan 1, 1977
At the date of observation
Value
Absolute change
Change from previous value
jan 1, 1975
36.754
+36.754
0.0%
jan 1, 1976
35.567
-1.187
-3.23%
jan 1, 1977
38.333
+2.766
7.78%
jan 1, 1978
36.923
-1.41
-3.68%
jan 1, 1980
35.077
-1.846
-5.0%
jan 1, 1987
29.07
-6.007
-17.13%
jan 1, 1988
27.977
-1.093
-3.76%
jan 1, 1989
26.242
-1.734
-6.2%
jan 1, 1991
24.629
-1.613
-6.15%
jan 1, 1992
22.46
-2.169
-8.81%
jan 1, 1993
18.519
-3.941
-17.55%
jan 1, 1994
22.901
+4.382
23.66%
jan 1, 2000
18.314
-4.586
-20.03%
jan 1, 2001
14.993
-3.322
-18.14%
jan 1, 2002
17.692
+2.7
18.01%
jan 1, 2003
15.881
-1.811
-10.24%
jan 1, 2004
11.911
-3.97
-25.0%
jan 1, 2005
13.422
+1.511
12.69%
jan 1, 2006
14.046
+0.624
4.65%
jan 1, 2007
13.903
-0.142
-1.01%
jan 1, 2008
13.838
-0.065
-0.47%
jan 1, 2009
14.859
+1.021
7.38%
jan 1, 2010
13.507
-1.352
-9.1%
jan 1, 2011
13.803
+0.296
2.19%
jan 1, 2012
10.793
-3.01
-21.81%
jan 1, 2013
10.837
+0.045
0.41%
jan 1, 2014
12.537
+1.699
15.68%
jan 1, 2015
12.891
+0.354
2.82%
Ranking of countries by current statistics by years


Comments: