29
/
en
AIzaSyAYiBZKx7MnpbEhh9jyipgxe19OcubqV5w
April 1, 2024
164191
Japan
JPN
true
2
1
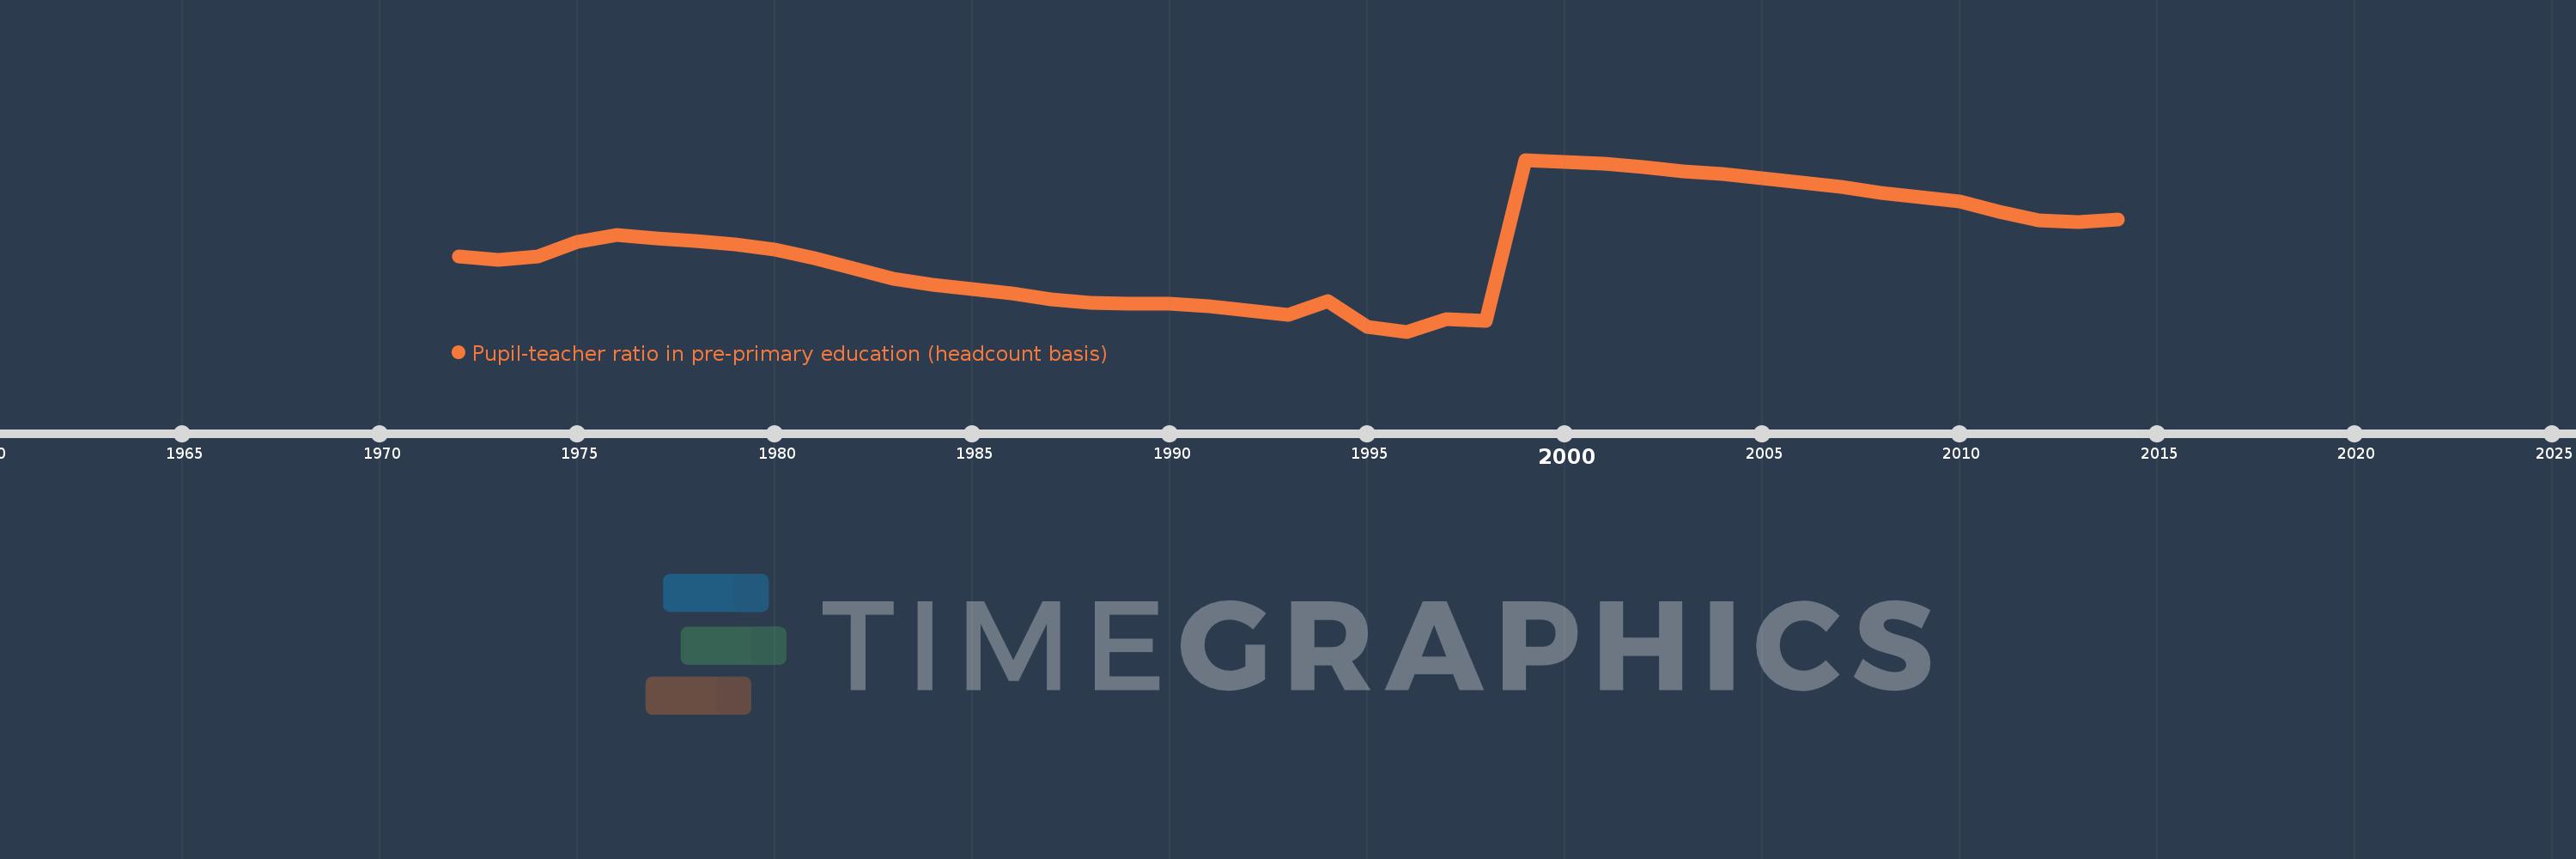
Pupil-teacher ratio in pre-primary education (headcount basis)
2014,2013,2012,2011,2010,2009,2008,2007,2006,2005,2004,2003,2002,2001,2000,1999,1998,1997,1996,1995,1994,1993,1992,1991,1990,1989,1988,1987,1986,1985,1984,1983,1982,1981,1980,1979,1978,1977,1976,1975,1974,1973,1972
This statistics in other country:
AfghanistanAlbaniaAlgeriaAndorraAngolaAntigua and BarbudaArab WorldArgentinaArmeniaArubaAustriaAzerbaijanBahamas, TheBahrainBangladeshBarbadosBelarusBelgiumBelizeBeninBermudaBhutanBoliviaBosnia and HerzegovinaBotswanaBrazilBritish Virgin IslandsBrunei DarussalamBulgariaBurkina FasoBurundiCabo VerdeCambodiaCameroonCanadaCaribbean small statesCayman IslandsCentral African RepublicCentral Europe and the BalticsChadChileChinaColombiaComorosCongo, Dem. Rep.Congo, Rep.Costa RicaCote d'IvoireCroatiaCubaCyprusCzech RepublicDenmarkDjiboutiDominicaDominican RepublicEarly-demographic dividendEast Asia & PacificEast Asia & Pacific (excluding high income)East Asia & Pacific (IDA & IBRD countries)EcuadorEgypt, Arab Rep.El SalvadorEquatorial GuineaEritreaEstoniaEthiopiaEuro areaEurope & Central AsiaEurope & Central Asia (excluding high income)Europe & Central Asia (IDA & IBRD countries)European UnionFijiFinlandFragile and conflict affected situationsFranceGabonGambia, TheGeorgiaGermanyGhanaGibraltarGreeceGrenadaGuatemalaGuineaGuinea-BissauGuyanaHaitiHeavily indebted poor countries (HIPC)High incomeHondurasHong Kong SAR, ChinaHungaryIBRD onlyIcelandIDA & IBRD totalIDA blendIDA onlyIDA totalIndiaIndonesiaIran, Islamic Rep.IraqIrelandIsraelItalyJamaicaJapanJordanKazakhstanKenyaKorea, Dem. People’s Rep.Korea, Rep.KuwaitKyrgyz RepublicLao PDRLate-demographic dividendLatin America & Caribbean Latin America & Caribbean (excluding high income)Latin America & the Caribbean (IDA & IBRD countries)LatviaLeast developed countries: UN classificationLebanonLesothoLiberiaLibyaLiechtensteinLithuaniaLow & middle incomeLow incomeLower middle incomeLuxembourgMacao SAR, ChinaMacedonia, FYRMadagascarMalaysiaMaldivesMaliMaltaMarshall IslandsMauritaniaMauritiusMexicoMiddle East & North AfricaMiddle East & North Africa (excluding high income)Middle East & North Africa (IDA & IBRD countries)Middle incomeMoldovaMonacoMongoliaMontenegroMoroccoMozambiqueMyanmarNamibiaNauruNepalNetherlandsNew ZealandNicaraguaNigerNigeriaNorth AmericaNorwayOECD membersOmanOther small statesPacific island small statesPalauPanamaPapua New GuineaParaguayPeruPhilippinesPolandPortugalPost-demographic dividendPre-demographic dividendPuerto RicoQatarRomaniaRussian FederationRwandaSamoaSan MarinoSao Tome and PrincipeSaudi ArabiaSenegalSerbiaSeychellesSierra LeoneSingaporeSlovak RepublicSloveniaSmall statesSolomon IslandsSomaliaSouth AfricaSouth AsiaSouth Asia (IDA & IBRD)South SudanSpainSt. Kitts and NevisSt. LuciaSt. Vincent and the GrenadinesSub-Saharan Africa Sub-Saharan Africa (excluding high income)Sub-Saharan Africa (IDA & IBRD countries)SudanSurinameSwazilandSwedenSwitzerlandSyrian Arab RepublicTajikistanTanzaniaThailandTimor-LesteTogoTongaTrinidad and TobagoTunisiaTurkeyTurks and Caicos IslandsTuvaluUgandaUkraineUnited Arab EmiratesUnited KingdomUnited StatesUpper middle incomeUruguayUzbekistanVanuatuVenezuela, RBVietnamWest Bank and GazaWorldYemen, Rep.Zimbabwe Timeline:
This timeline shows a graph from 1972 to 2014 of Japan. No data until 1971. Number of actual observations by date: 43.
Source name:
World Development Indicators
Source organization:
UNESCO Institute for Statistics
Categories, topics:
Education
Last updated:
apr 23, 2017
Indicators value changes by year
Minimum:
16.492
jan 1, 1996
Maximum:
31.077
jan 1, 1999
At the date of observation
Value
Absolute change
Change from previous value
jan 1, 1972
22.87
+22.87
0.0%
jan 1, 1973
22.599
-0.271
-1.19%
jan 1, 1974
22.857
+0.258
1.14%
jan 1, 1975
24.112
+1.254
5.49%
jan 1, 1976
24.726
+0.614
2.55%
jan 1, 1977
24.427
-0.299
-1.21%
jan 1, 1978
24.18
-0.247
-1.01%
jan 1, 1979
23.918
-0.262
-1.08%
jan 1, 1980
23.491
-0.427
-1.78%
jan 1, 1981
22.744
-0.747
-3.18%
jan 1, 1982
21.875
-0.869
-3.82%
jan 1, 1983
20.974
-0.901
-4.12%
jan 1, 1984
20.468
-0.506
-2.41%
jan 1, 1985
20.101
-0.367
-1.79%
jan 1, 1986
19.701
-0.4
-1.99%
jan 1, 1987
19.218
-0.483
-2.45%
jan 1, 1988
18.906
-0.312
-1.62%
jan 1, 1989
18.837
-0.069
-0.36%
jan 1, 1990
18.839
+0.002
0.01%
jan 1, 1991
18.655
-0.184
-0.97%
jan 1, 1992
18.295
-0.36
-1.93%
jan 1, 1993
17.921
-0.374
-2.05%
jan 1, 1994
19.054
+1.133
6.32%
jan 1, 1995
16.883
-2.172
-11.4%
jan 1, 1996
16.492
-0.391
-2.32%
jan 1, 1997
17.559
+1.067
6.47%
jan 1, 1998
17.369
-0.19
-1.08%
jan 1, 1999
31.077
+13.708
78.92%
jan 1, 2000
30.868
-0.209
-0.67%
jan 1, 2001
30.785
-0.083
-0.27%
jan 1, 2002
30.435
-0.35
-1.14%
jan 1, 2003
30.113
-0.321
-1.06%
jan 1, 2004
29.864
-0.249
-0.83%
jan 1, 2005
29.524
-0.34
-1.14%
jan 1, 2006
29.168
-0.356
-1.21%
jan 1, 2007
28.763
-0.405
-1.39%
jan 1, 2008
28.299
-0.464
-1.61%
jan 1, 2009
27.885
-0.414
-1.46%
jan 1, 2010
27.524
-0.362
-1.3%
jan 1, 2011
26.667
-0.857
-3.11%
jan 1, 2012
25.935
-0.731
-2.74%
jan 1, 2013
25.797
-0.138
-0.53%
jan 1, 2014
25.998
+0.2
0.78%
Ranking of countries by current statistics by years


Comments: