29
/
en
AIzaSyAYiBZKx7MnpbEhh9jyipgxe19OcubqV5w
April 1, 2024
91799
Brazil
BRA
true
2
1
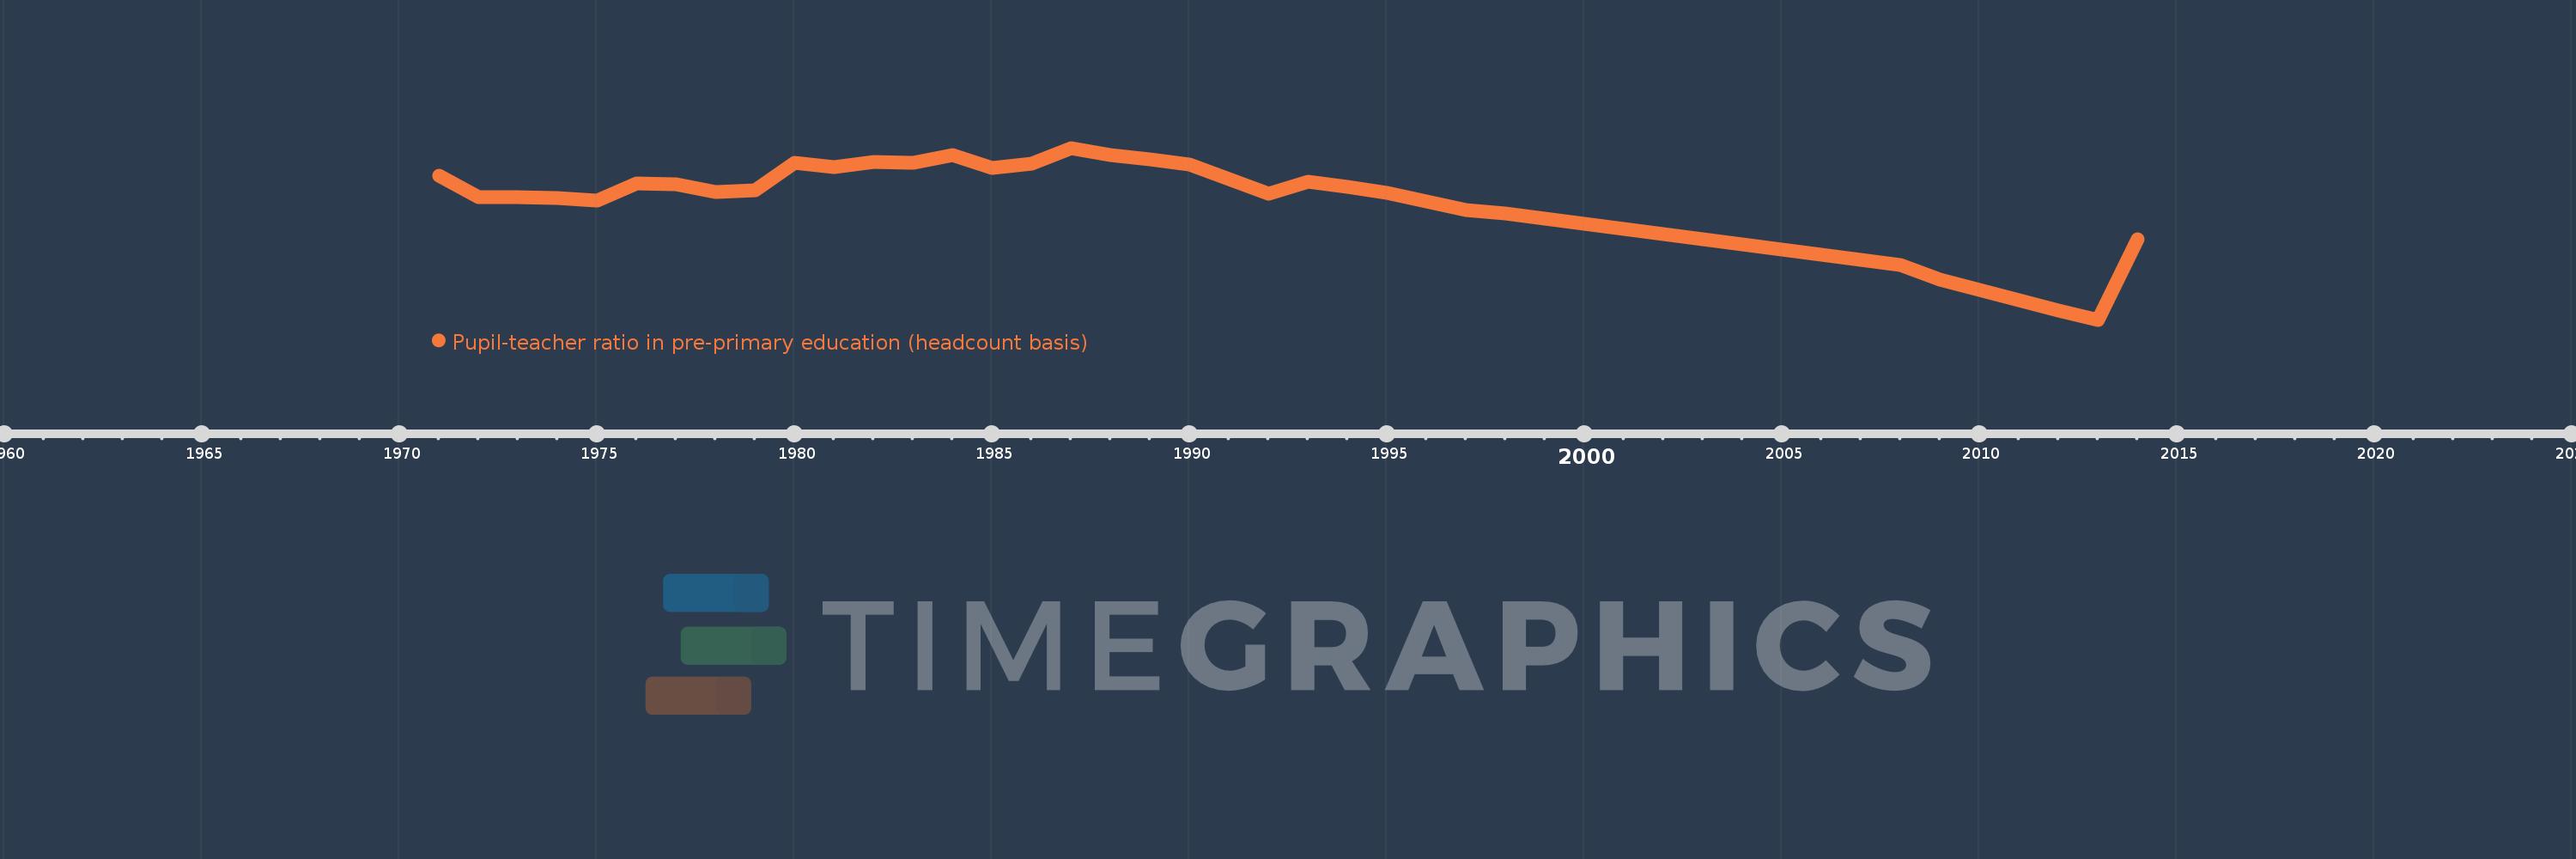
Pupil-teacher ratio in pre-primary education (headcount basis)
2014,2013,2012,2011,2010,2009,2008,1998,1997,1995,1994,1993,1992,1990,1989,1988,1987,1986,1985,1984,1983,1982,1981,1980,1979,1978,1977,1976,1975,1974,1973,1972,1971
This statistics in other country:
AfghanistanAlbaniaAlgeriaAndorraAngolaAntigua and BarbudaArab WorldArgentinaArmeniaArubaAustriaAzerbaijanBahamas, TheBahrainBangladeshBarbadosBelarusBelgiumBelizeBeninBermudaBhutanBoliviaBosnia and HerzegovinaBotswanaBrazilBritish Virgin IslandsBrunei DarussalamBulgariaBurkina FasoBurundiCabo VerdeCambodiaCameroonCanadaCaribbean small statesCayman IslandsCentral African RepublicCentral Europe and the BalticsChadChileChinaColombiaComorosCongo, Dem. Rep.Congo, Rep.Costa RicaCote d'IvoireCroatiaCubaCyprusCzech RepublicDenmarkDjiboutiDominicaDominican RepublicEarly-demographic dividendEast Asia & PacificEast Asia & Pacific (excluding high income)East Asia & Pacific (IDA & IBRD countries)EcuadorEgypt, Arab Rep.El SalvadorEquatorial GuineaEritreaEstoniaEthiopiaEuro areaEurope & Central AsiaEurope & Central Asia (excluding high income)Europe & Central Asia (IDA & IBRD countries)European UnionFijiFinlandFragile and conflict affected situationsFranceGabonGambia, TheGeorgiaGermanyGhanaGibraltarGreeceGrenadaGuatemalaGuineaGuinea-BissauGuyanaHaitiHeavily indebted poor countries (HIPC)High incomeHondurasHong Kong SAR, ChinaHungaryIBRD onlyIcelandIDA & IBRD totalIDA blendIDA onlyIDA totalIndiaIndonesiaIran, Islamic Rep.IraqIrelandIsraelItalyJamaicaJapanJordanKazakhstanKenyaKorea, Dem. People’s Rep.Korea, Rep.KuwaitKyrgyz RepublicLao PDRLate-demographic dividendLatin America & Caribbean Latin America & Caribbean (excluding high income)Latin America & the Caribbean (IDA & IBRD countries)LatviaLeast developed countries: UN classificationLebanonLesothoLiberiaLibyaLiechtensteinLithuaniaLow & middle incomeLow incomeLower middle incomeLuxembourgMacao SAR, ChinaMacedonia, FYRMadagascarMalaysiaMaldivesMaliMaltaMarshall IslandsMauritaniaMauritiusMexicoMiddle East & North AfricaMiddle East & North Africa (excluding high income)Middle East & North Africa (IDA & IBRD countries)Middle incomeMoldovaMonacoMongoliaMontenegroMoroccoMozambiqueMyanmarNamibiaNauruNepalNetherlandsNew ZealandNicaraguaNigerNigeriaNorth AmericaNorwayOECD membersOmanOther small statesPacific island small statesPalauPanamaPapua New GuineaParaguayPeruPhilippinesPolandPortugalPost-demographic dividendPre-demographic dividendPuerto RicoQatarRomaniaRussian FederationRwandaSamoaSan MarinoSao Tome and PrincipeSaudi ArabiaSenegalSerbiaSeychellesSierra LeoneSingaporeSlovak RepublicSloveniaSmall statesSolomon IslandsSomaliaSouth AfricaSouth AsiaSouth Asia (IDA & IBRD)South SudanSpainSt. Kitts and NevisSt. LuciaSt. Vincent and the GrenadinesSub-Saharan Africa Sub-Saharan Africa (excluding high income)Sub-Saharan Africa (IDA & IBRD countries)SudanSurinameSwazilandSwedenSwitzerlandSyrian Arab RepublicTajikistanTanzaniaThailandTimor-LesteTogoTongaTrinidad and TobagoTunisiaTurkeyTurks and Caicos IslandsTuvaluUgandaUkraineUnited Arab EmiratesUnited KingdomUnited StatesUpper middle incomeUruguayUzbekistanVanuatuVenezuela, RBVietnamWest Bank and GazaWorldYemen, Rep.Zimbabwe Timeline:
This timeline shows a graph from 1971 to 2014 of Brazil. No data until 1970. Number of actual observations by date: 33.
Source name:
World Development Indicators
Source organization:
UNESCO Institute for Statistics
Categories, topics:
Education
Last updated:
apr 23, 2017
Indicators value changes by year
Minimum:
10.771
jan 1, 2013
Maximum:
24.219
jan 1, 1987
At the date of observation
Value
Absolute change
Change from previous value
jan 1, 1971
22.021
+22.021
0.0%
jan 1, 1972
20.382
-1.639
-7.44%
jan 1, 1973
20.365
-0.017
-0.08%
jan 1, 1974
20.3
-0.065
-0.32%
jan 1, 1975
20.104
-0.196
-0.96%
jan 1, 1976
21.445
+1.341
6.67%
jan 1, 1977
21.387
-0.058
-0.27%
jan 1, 1978
20.746
-0.641
-3.0%
jan 1, 1979
20.872
+0.126
0.61%
jan 1, 1980
23.024
+2.151
10.31%
jan 1, 1981
22.714
-0.31
-1.34%
jan 1, 1982
23.103
+0.389
1.71%
jan 1, 1983
23.034
-0.069
-0.3%
jan 1, 1984
23.643
+0.609
2.64%
jan 1, 1985
22.662
-0.981
-4.15%
jan 1, 1986
23.02
+0.357
1.58%
jan 1, 1987
24.219
+1.199
5.21%
jan 1, 1988
23.681
-0.538
-2.22%
jan 1, 1989
23.321
-0.36
-1.52%
jan 1, 1990
22.895
-0.426
-1.83%
jan 1, 1992
20.623
-2.272
-9.92%
jan 1, 1993
21.594
+0.97
4.7%
jan 1, 1994
21.204
-0.39
-1.8%
jan 1, 1995
20.711
-0.493
-2.33%
jan 1, 1997
19.337
-1.374
-6.63%
jan 1, 1998
19.072
-0.265
-1.37%
jan 1, 2008
15.083
-3.988
-20.91%
jan 1, 2009
13.908
-1.175
-7.79%
jan 1, 2010
13.078
-0.83
-5.97%
jan 1, 2011
12.281
-0.797
-6.09%
jan 1, 2012
11.48
-0.802
-6.53%
jan 1, 2013
10.771
-0.709
-6.18%
jan 1, 2014
17.103
+6.332
58.79%
Ranking of countries by current statistics by years


Comments: