29
/
en
AIzaSyAYiBZKx7MnpbEhh9jyipgxe19OcubqV5w
April 1, 2024
233207
San Marino
SMR
true
2
1
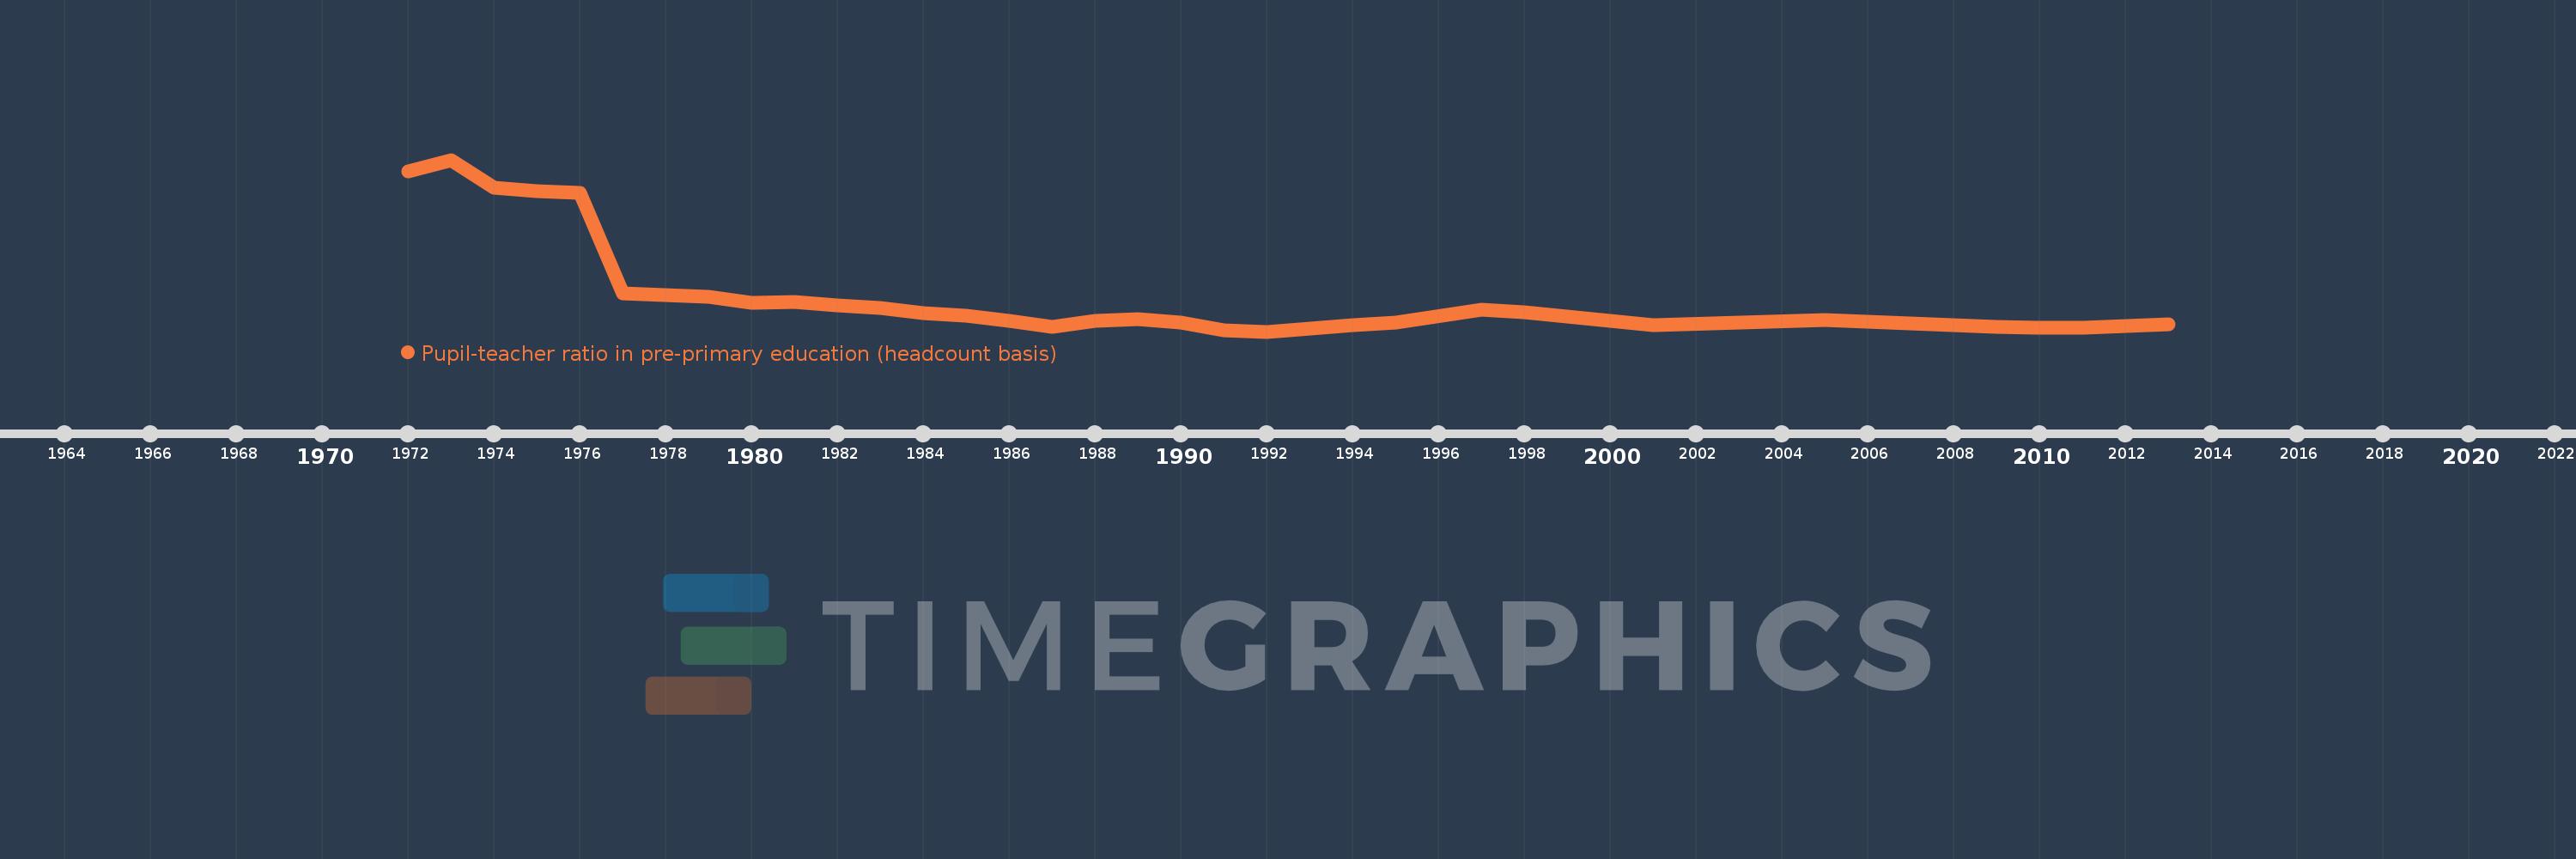
Pupil-teacher ratio in pre-primary education (headcount basis)
2013,2012,2011,2010,2009,2005,2001,1998,1997,1995,1994,1993,1992,1991,1990,1989,1988,1987,1986,1985,1984,1983,1982,1981,1980,1979,1978,1977,1976,1975,1974,1973,1972
This statistics in other country:
AfghanistanAlbaniaAlgeriaAndorraAngolaAntigua and BarbudaArab WorldArgentinaArmeniaArubaAustriaAzerbaijanBahamas, TheBahrainBangladeshBarbadosBelarusBelgiumBelizeBeninBermudaBhutanBoliviaBosnia and HerzegovinaBotswanaBrazilBritish Virgin IslandsBrunei DarussalamBulgariaBurkina FasoBurundiCabo VerdeCambodiaCameroonCanadaCaribbean small statesCayman IslandsCentral African RepublicCentral Europe and the BalticsChadChileChinaColombiaComorosCongo, Dem. Rep.Congo, Rep.Costa RicaCote d'IvoireCroatiaCubaCyprusCzech RepublicDenmarkDjiboutiDominicaDominican RepublicEarly-demographic dividendEast Asia & PacificEast Asia & Pacific (excluding high income)East Asia & Pacific (IDA & IBRD countries)EcuadorEgypt, Arab Rep.El SalvadorEquatorial GuineaEritreaEstoniaEthiopiaEuro areaEurope & Central AsiaEurope & Central Asia (excluding high income)Europe & Central Asia (IDA & IBRD countries)European UnionFijiFinlandFragile and conflict affected situationsFranceGabonGambia, TheGeorgiaGermanyGhanaGibraltarGreeceGrenadaGuatemalaGuineaGuinea-BissauGuyanaHaitiHeavily indebted poor countries (HIPC)High incomeHondurasHong Kong SAR, ChinaHungaryIBRD onlyIcelandIDA & IBRD totalIDA blendIDA onlyIDA totalIndiaIndonesiaIran, Islamic Rep.IraqIrelandIsraelItalyJamaicaJapanJordanKazakhstanKenyaKorea, Dem. People’s Rep.Korea, Rep.KuwaitKyrgyz RepublicLao PDRLate-demographic dividendLatin America & Caribbean Latin America & Caribbean (excluding high income)Latin America & the Caribbean (IDA & IBRD countries)LatviaLeast developed countries: UN classificationLebanonLesothoLiberiaLibyaLiechtensteinLithuaniaLow & middle incomeLow incomeLower middle incomeLuxembourgMacao SAR, ChinaMacedonia, FYRMadagascarMalaysiaMaldivesMaliMaltaMarshall IslandsMauritaniaMauritiusMexicoMiddle East & North AfricaMiddle East & North Africa (excluding high income)Middle East & North Africa (IDA & IBRD countries)Middle incomeMoldovaMonacoMongoliaMontenegroMoroccoMozambiqueMyanmarNamibiaNauruNepalNetherlandsNew ZealandNicaraguaNigerNigeriaNorth AmericaNorwayOECD membersOmanOther small statesPacific island small statesPalauPanamaPapua New GuineaParaguayPeruPhilippinesPolandPortugalPost-demographic dividendPre-demographic dividendPuerto RicoQatarRomaniaRussian FederationRwandaSamoaSan MarinoSao Tome and PrincipeSaudi ArabiaSenegalSerbiaSeychellesSierra LeoneSingaporeSlovak RepublicSloveniaSmall statesSolomon IslandsSomaliaSouth AfricaSouth AsiaSouth Asia (IDA & IBRD)South SudanSpainSt. Kitts and NevisSt. LuciaSt. Vincent and the GrenadinesSub-Saharan Africa Sub-Saharan Africa (excluding high income)Sub-Saharan Africa (IDA & IBRD countries)SudanSurinameSwazilandSwedenSwitzerlandSyrian Arab RepublicTajikistanTanzaniaThailandTimor-LesteTogoTongaTrinidad and TobagoTunisiaTurkeyTurks and Caicos IslandsTuvaluUgandaUkraineUnited Arab EmiratesUnited KingdomUnited StatesUpper middle incomeUruguayUzbekistanVanuatuVenezuela, RBVietnamWest Bank and GazaWorldYemen, Rep.Zimbabwe Timeline:
This timeline shows a graph from 1972 to 2013 of San Marino. No data until 1971. Number of actual observations by date: 33.
Source name:
World Development Indicators
Source organization:
UNESCO Institute for Statistics
Categories, topics:
Education
Last updated:
apr 23, 2017
Indicators value changes by year
Maximum:
23.933
jan 1, 1973
At the date of observation
Value
Absolute change
Change from previous value
jan 1, 1972
22.8
+22.8
0.0%
jan 1, 1973
23.933
+1.133
4.97%
jan 1, 1974
21.2
-2.733
-11.42%
jan 1, 1975
20.857
-0.343
-1.62%
jan 1, 1976
20.706
-0.151
-0.73%
jan 1, 1977
10.809
-9.897
-47.8%
jan 1, 1978
10.594
-0.215
-1.99%
jan 1, 1979
10.411
-0.183
-1.73%
jan 1, 1980
9.892
-0.519
-4.99%
jan 1, 1981
9.909
+0.017
0.17%
jan 1, 1982
9.637
-0.272
-2.74%
jan 1, 1983
9.391
-0.246
-2.55%
jan 1, 1984
8.837
-0.555
-5.91%
jan 1, 1985
8.566
-0.271
-3.07%
jan 1, 1986
8.067
-0.498
-5.82%
jan 1, 1987
7.468
-0.599
-7.43%
jan 1, 1988
8.079
+0.611
8.19%
jan 1, 1989
8.23
+0.151
1.87%
jan 1, 1990
7.93
-0.3
-3.65%
jan 1, 1991
7.157
-0.773
-9.74%
jan 1, 1992
7.028
-0.13
-1.81%
jan 1, 1993
7.282
+0.254
3.61%
jan 1, 1994
7.621
+0.34
4.67%
jan 1, 1995
7.951
+0.33
4.32%
jan 1, 1997
9.223
+1.272
16.0%
jan 1, 1998
8.896
-0.328
-3.55%
jan 1, 2001
7.635
-1.261
-14.17%
jan 1, 2005
8.206
+0.571
7.48%
jan 1, 2009
7.504
-0.702
-8.56%
jan 1, 2010
7.38
-0.123
-1.64%
jan 1, 2011
7.432
+0.051
0.7%
jan 1, 2012
7.543
+0.111
1.5%
jan 1, 2013
7.761
+0.218
2.89%
Ranking of countries by current statistics by years


Comments: