29
/
en
AIzaSyAYiBZKx7MnpbEhh9jyipgxe19OcubqV5w
April 1, 2024
41865
Latin America & Caribbean
LCN
false
2
1
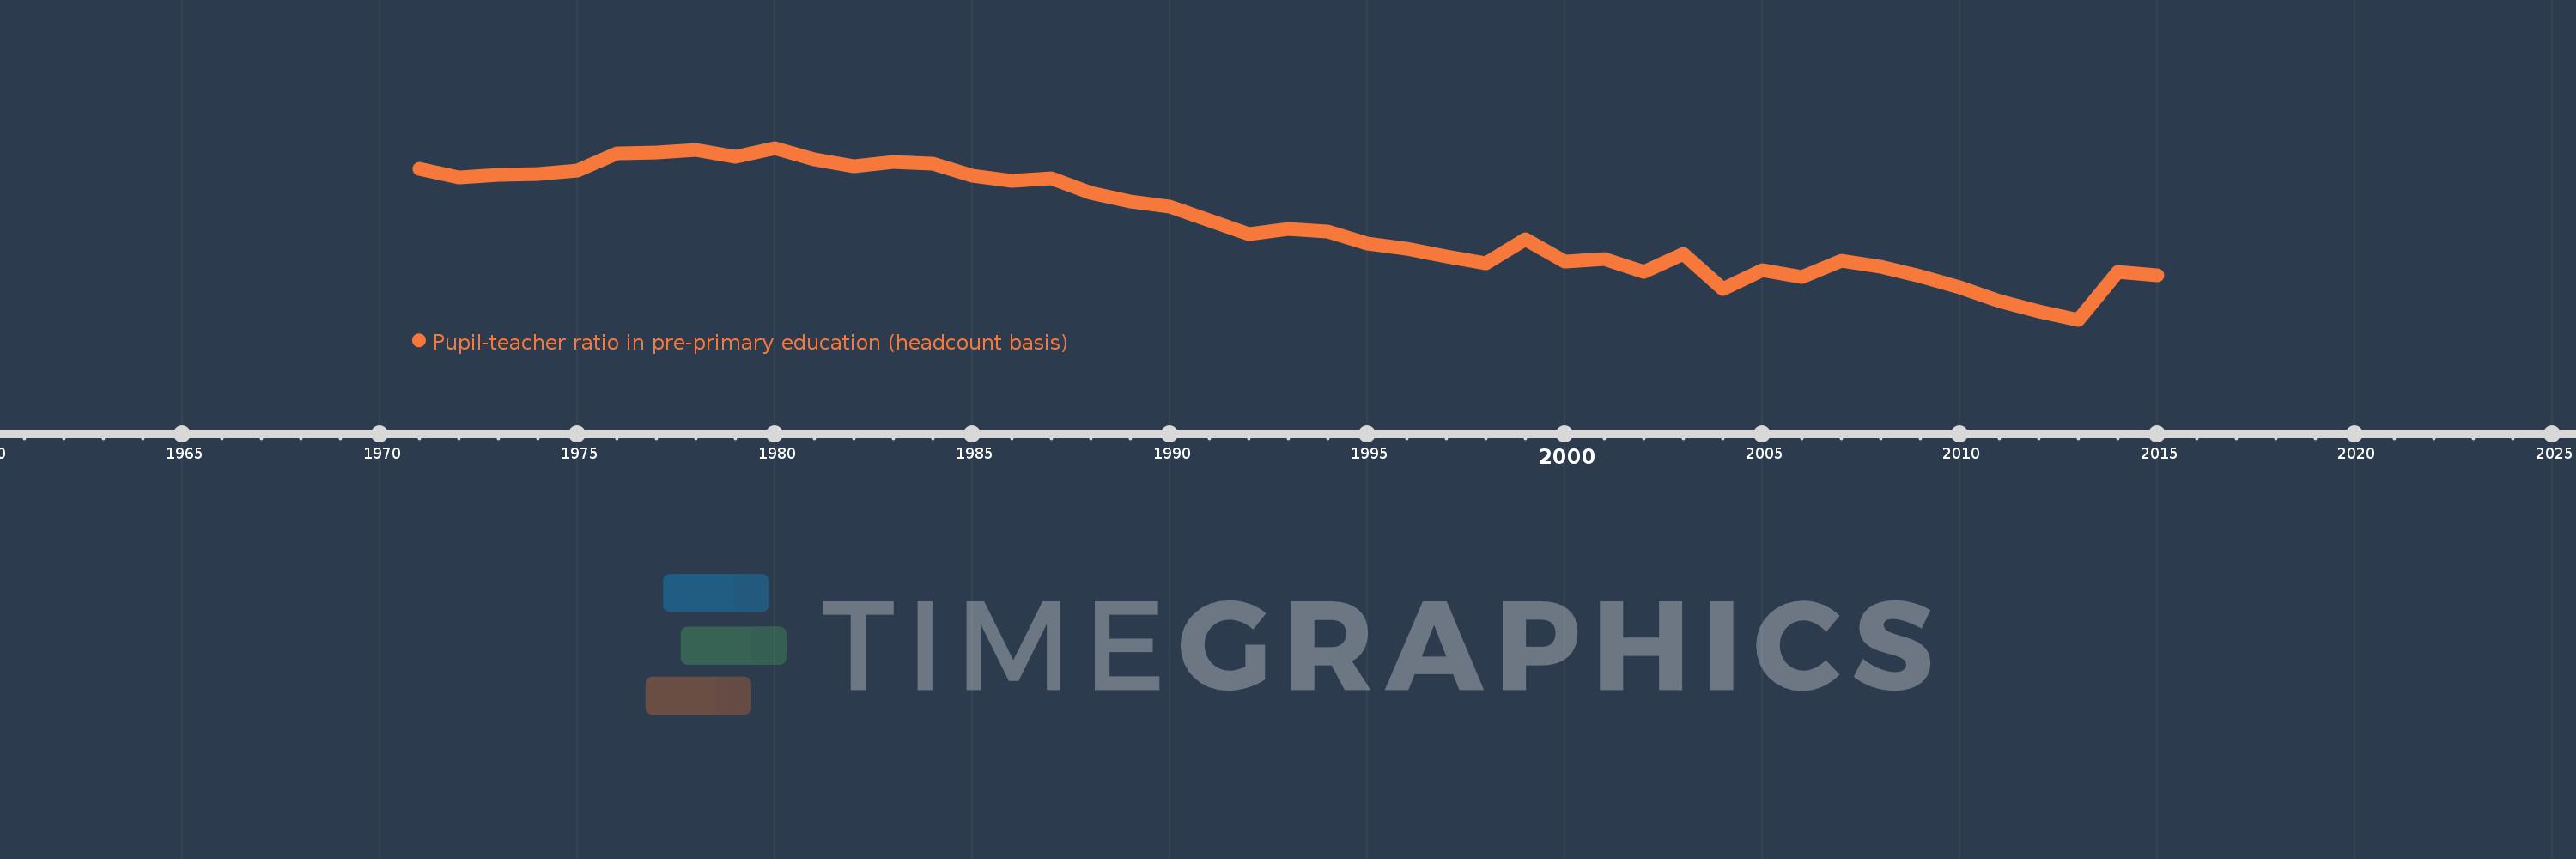
Pupil-teacher ratio in pre-primary education (headcount basis)
2015,2014,2013,2012,2011,2010,2009,2008,2007,2006,2005,2004,2003,2002,2001,2000,1999,1998,1997,1996,1995,1994,1993,1992,1991,1990,1989,1988,1987,1986,1985,1984,1983,1982,1981,1980,1979,1978,1977,1976,1975,1974,1973,1972,1971
This statistics in other country:
AfghanistanAlbaniaAlgeriaAndorraAngolaAntigua and BarbudaArab WorldArgentinaArmeniaArubaAustriaAzerbaijanBahamas, TheBahrainBangladeshBarbadosBelarusBelgiumBelizeBeninBermudaBhutanBoliviaBosnia and HerzegovinaBotswanaBrazilBritish Virgin IslandsBrunei DarussalamBulgariaBurkina FasoBurundiCabo VerdeCambodiaCameroonCanadaCaribbean small statesCayman IslandsCentral African RepublicCentral Europe and the BalticsChadChileChinaColombiaComorosCongo, Dem. Rep.Congo, Rep.Costa RicaCote d'IvoireCroatiaCubaCyprusCzech RepublicDenmarkDjiboutiDominicaDominican RepublicEarly-demographic dividendEast Asia & PacificEast Asia & Pacific (excluding high income)East Asia & Pacific (IDA & IBRD countries)EcuadorEgypt, Arab Rep.El SalvadorEquatorial GuineaEritreaEstoniaEthiopiaEuro areaEurope & Central AsiaEurope & Central Asia (excluding high income)Europe & Central Asia (IDA & IBRD countries)European UnionFijiFinlandFragile and conflict affected situationsFranceGabonGambia, TheGeorgiaGermanyGhanaGibraltarGreeceGrenadaGuatemalaGuineaGuinea-BissauGuyanaHaitiHeavily indebted poor countries (HIPC)High incomeHondurasHong Kong SAR, ChinaHungaryIBRD onlyIcelandIDA & IBRD totalIDA blendIDA onlyIDA totalIndiaIndonesiaIran, Islamic Rep.IraqIrelandIsraelItalyJamaicaJapanJordanKazakhstanKenyaKorea, Dem. People’s Rep.Korea, Rep.KuwaitKyrgyz RepublicLao PDRLate-demographic dividendLatin America & Caribbean Latin America & Caribbean (excluding high income)Latin America & the Caribbean (IDA & IBRD countries)LatviaLeast developed countries: UN classificationLebanonLesothoLiberiaLibyaLiechtensteinLithuaniaLow & middle incomeLow incomeLower middle incomeLuxembourgMacao SAR, ChinaMacedonia, FYRMadagascarMalaysiaMaldivesMaliMaltaMarshall IslandsMauritaniaMauritiusMexicoMiddle East & North AfricaMiddle East & North Africa (excluding high income)Middle East & North Africa (IDA & IBRD countries)Middle incomeMoldovaMonacoMongoliaMontenegroMoroccoMozambiqueMyanmarNamibiaNauruNepalNetherlandsNew ZealandNicaraguaNigerNigeriaNorth AmericaNorwayOECD membersOmanOther small statesPacific island small statesPalauPanamaPapua New GuineaParaguayPeruPhilippinesPolandPortugalPost-demographic dividendPre-demographic dividendPuerto RicoQatarRomaniaRussian FederationRwandaSamoaSan MarinoSao Tome and PrincipeSaudi ArabiaSenegalSerbiaSeychellesSierra LeoneSingaporeSlovak RepublicSloveniaSmall statesSolomon IslandsSomaliaSouth AfricaSouth AsiaSouth Asia (IDA & IBRD)South SudanSpainSt. Kitts and NevisSt. LuciaSt. Vincent and the GrenadinesSub-Saharan Africa Sub-Saharan Africa (excluding high income)Sub-Saharan Africa (IDA & IBRD countries)SudanSurinameSwazilandSwedenSwitzerlandSyrian Arab RepublicTajikistanTanzaniaThailandTimor-LesteTogoTongaTrinidad and TobagoTunisiaTurkeyTurks and Caicos IslandsTuvaluUgandaUkraineUnited Arab EmiratesUnited KingdomUnited StatesUpper middle incomeUruguayUzbekistanVanuatuVenezuela, RBVietnamWest Bank and GazaWorldYemen, Rep.Zimbabwe Timeline:
This timeline shows a graph from 1971 to 2015 of Latin America & Caribbean . No data until 1970. Number of actual observations by date: 45.
Source name:
World Development Indicators
Source organization:
UNESCO Institute for Statistics
Categories, topics:
Education
Last updated:
apr 23, 2017
Indicators value changes by year
Minimum:
16.732
jan 1, 2013
Maximum:
27.553
jan 1, 1980
At the date of observation
Value
Absolute change
Change from previous value
jan 1, 1971
26.257
+26.257
0.0%
jan 1, 1972
25.691
-0.566
-2.16%
jan 1, 1973
25.863
+0.173
0.67%
jan 1, 1974
25.933
+0.07
0.27%
jan 1, 1975
26.142
+0.208
0.8%
jan 1, 1976
27.238
+1.096
4.19%
jan 1, 1977
27.266
+0.028
0.1%
jan 1, 1978
27.423
+0.157
0.57%
jan 1, 1979
27.011
-0.411
-1.5%
jan 1, 1980
27.553
+0.542
2.01%
jan 1, 1981
26.839
-0.714
-2.59%
jan 1, 1982
26.388
-0.451
-1.68%
jan 1, 1983
26.691
+0.303
1.15%
jan 1, 1984
26.584
-0.107
-0.4%
jan 1, 1985
25.818
-0.766
-2.88%
jan 1, 1986
25.466
-0.352
-1.37%
jan 1, 1987
25.621
+0.155
0.61%
jan 1, 1988
24.746
-0.875
-3.41%
jan 1, 1989
24.182
-0.564
-2.28%
jan 1, 1990
23.844
-0.338
-1.4%
jan 1, 1991
22.97
-0.874
-3.67%
jan 1, 1992
22.141
-0.829
-3.61%
jan 1, 1993
22.436
+0.294
1.33%
jan 1, 1994
22.275
-0.16
-0.72%
jan 1, 1995
21.538
-0.737
-3.31%
jan 1, 1996
21.232
-0.306
-1.42%
jan 1, 1997
20.731
-0.501
-2.36%
jan 1, 1998
20.265
-0.466
-2.25%
jan 1, 1999
21.787
+1.522
7.51%
jan 1, 2000
20.407
-1.38
-6.33%
jan 1, 2001
20.566
+0.158
0.78%
jan 1, 2002
19.724
-0.842
-4.09%
jan 1, 2003
20.88
+1.156
5.86%
jan 1, 2004
18.683
-2.197
-10.52%
jan 1, 2005
19.873
+1.19
6.37%
jan 1, 2006
19.419
-0.454
-2.28%
jan 1, 2007
20.46
+1.04
5.36%
jan 1, 2008
20.091
-0.368
-1.8%
jan 1, 2009
19.485
-0.606
-3.02%
jan 1, 2010
18.767
-0.718
-3.69%
jan 1, 2011
17.914
-0.853
-4.55%
jan 1, 2012
17.244
-0.67
-3.74%
jan 1, 2013
16.732
-0.512
-2.97%
jan 1, 2014
19.745
+3.013
18.01%
jan 1, 2015
19.547
-0.198
-1.0%
Ranking of countries by current statistics by years


Comments: