29
/
en
AIzaSyAYiBZKx7MnpbEhh9jyipgxe19OcubqV5w
April 1, 2024
48487
Middle East & North Africa
MEA
false
2
1
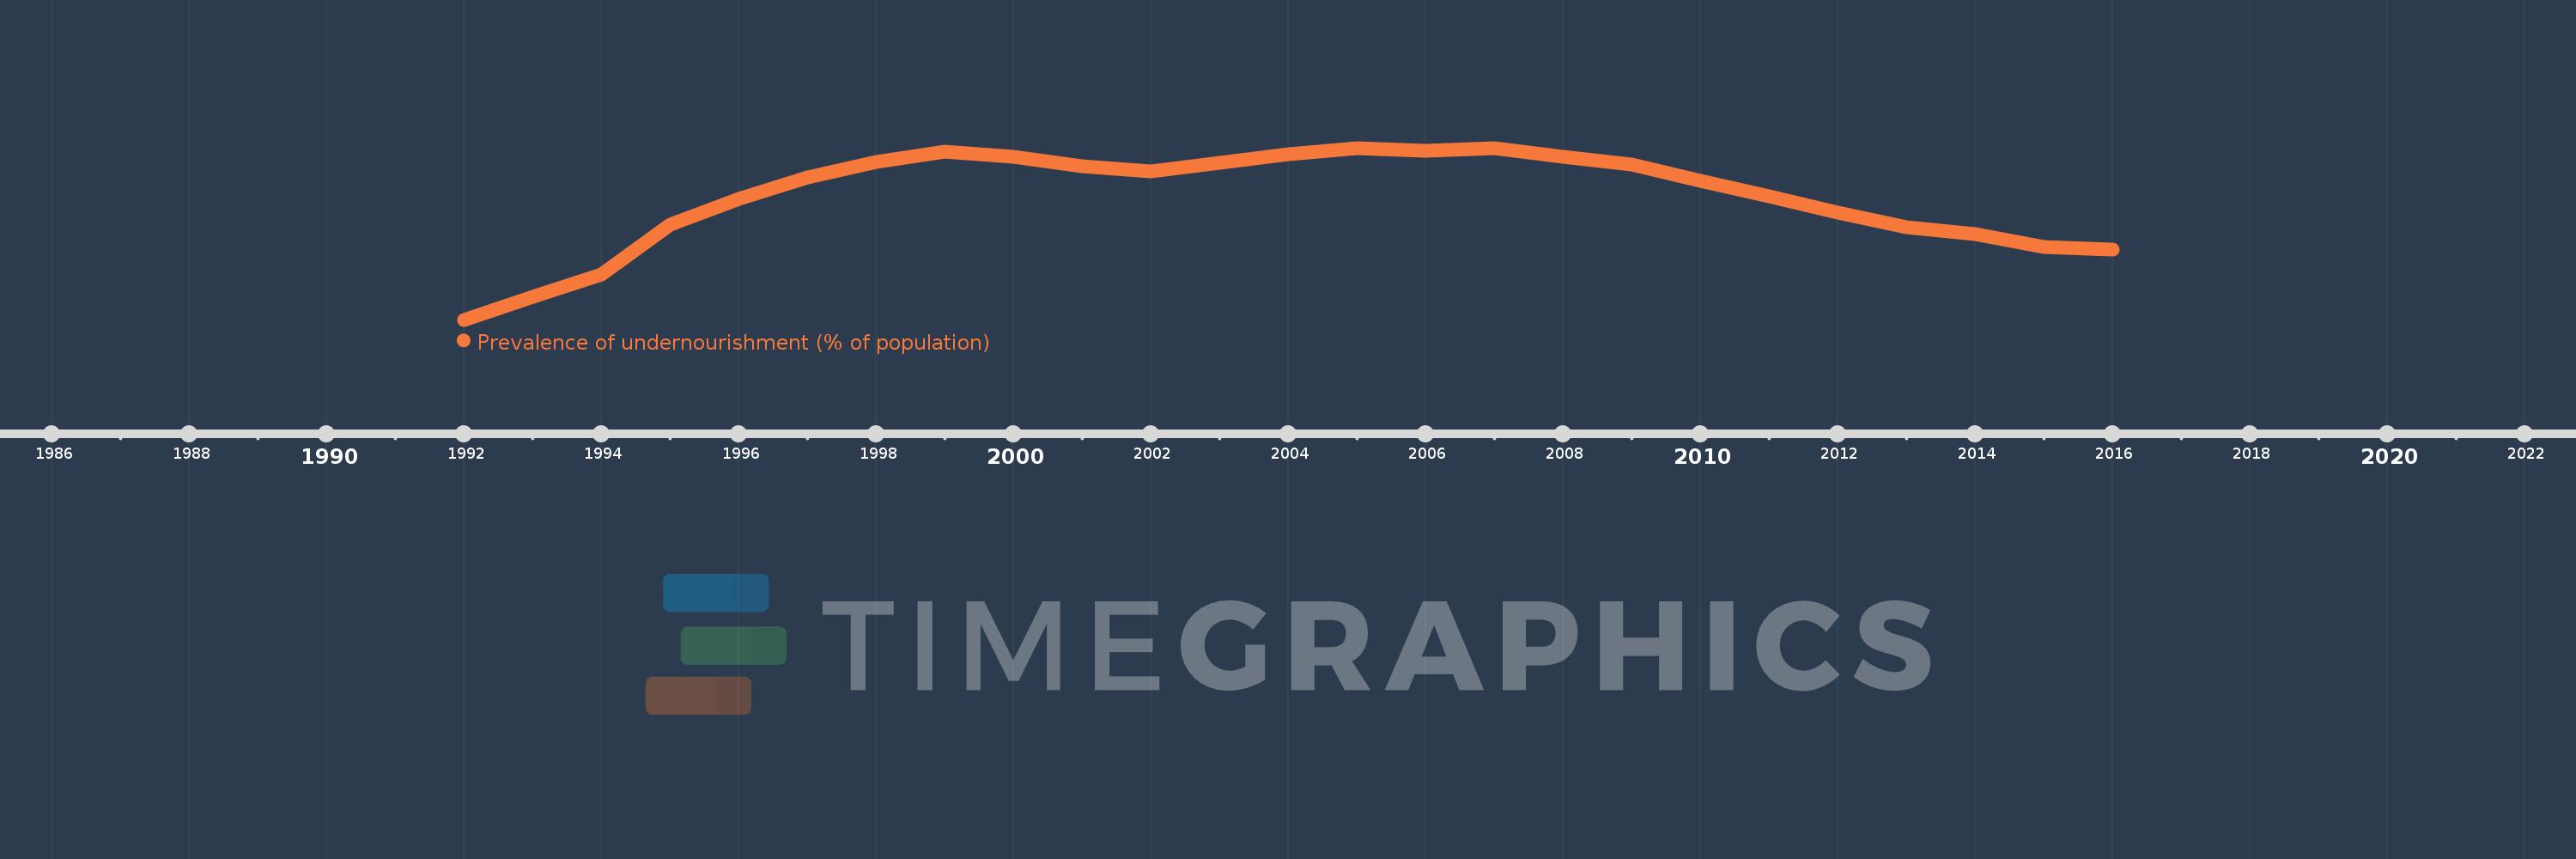
Prevalence of undernourishment (% of population)
2016,2015,2014,2013,2012,2011,2010,2009,2008,2007,2006,2005,2004,2003,2002,2001,2000,1999,1998,1997,1996,1995,1994,1993,1992
This statistics in other country:
Timeline:
This timeline shows a graph from 1992 to 2016 of Middle East & North Africa. No data until 1991. Number of actual observations by date: 25.
Source name:
World Development Indicators
Source organization:
Food and Agriculture Organization (http://www.fao.org/publications/en/).
Categories, topics:
Health
Last updated:
apr 23, 2017
Indicators value changes by year
At the date of observation
Value
Absolute change
Change from previous value
jan 1, 1992
7.512
+7.512
0.0%
jan 1, 1993
7.74
+0.228
3.04%
jan 1, 1994
7.953
+0.214
2.76%
jan 1, 1995
8.44
+0.486
6.11%
jan 1, 1996
8.696
+0.256
3.04%
jan 1, 1997
8.906
+0.21
2.41%
jan 1, 1998
9.062
+0.157
1.76%
jan 1, 1999
9.163
+0.1
1.11%
jan 1, 2000
9.111
-0.052
-0.56%
jan 1, 2001
9.013
-0.098
-1.08%
jan 1, 2002
8.969
-0.044
-0.48%
jan 1, 2003
9.051
+0.082
0.91%
jan 1, 2004
9.138
+0.088
0.97%
jan 1, 2005
9.19
+0.051
0.56%
jan 1, 2006
9.172
-0.017
-0.19%
jan 1, 2007
9.196
+0.024
0.26%
jan 1, 2008
9.109
-0.087
-0.95%
jan 1, 2009
9.033
-0.077
-0.84%
jan 1, 2010
8.874
-0.159
-1.76%
jan 1, 2011
8.718
-0.155
-1.75%
jan 1, 2012
8.559
-0.159
-1.82%
jan 1, 2013
8.416
-0.143
-1.67%
jan 1, 2014
8.349
-0.067
-0.79%
jan 1, 2015
8.222
-0.128
-1.53%
jan 1, 2016
8.201
-0.021
-0.25%
Ranking of countries by current statistics by years


Comments: