29
/
en
AIzaSyAYiBZKx7MnpbEhh9jyipgxe19OcubqV5w
April 1, 2024
281582
Venezuela, RB
VEN
true
2
1
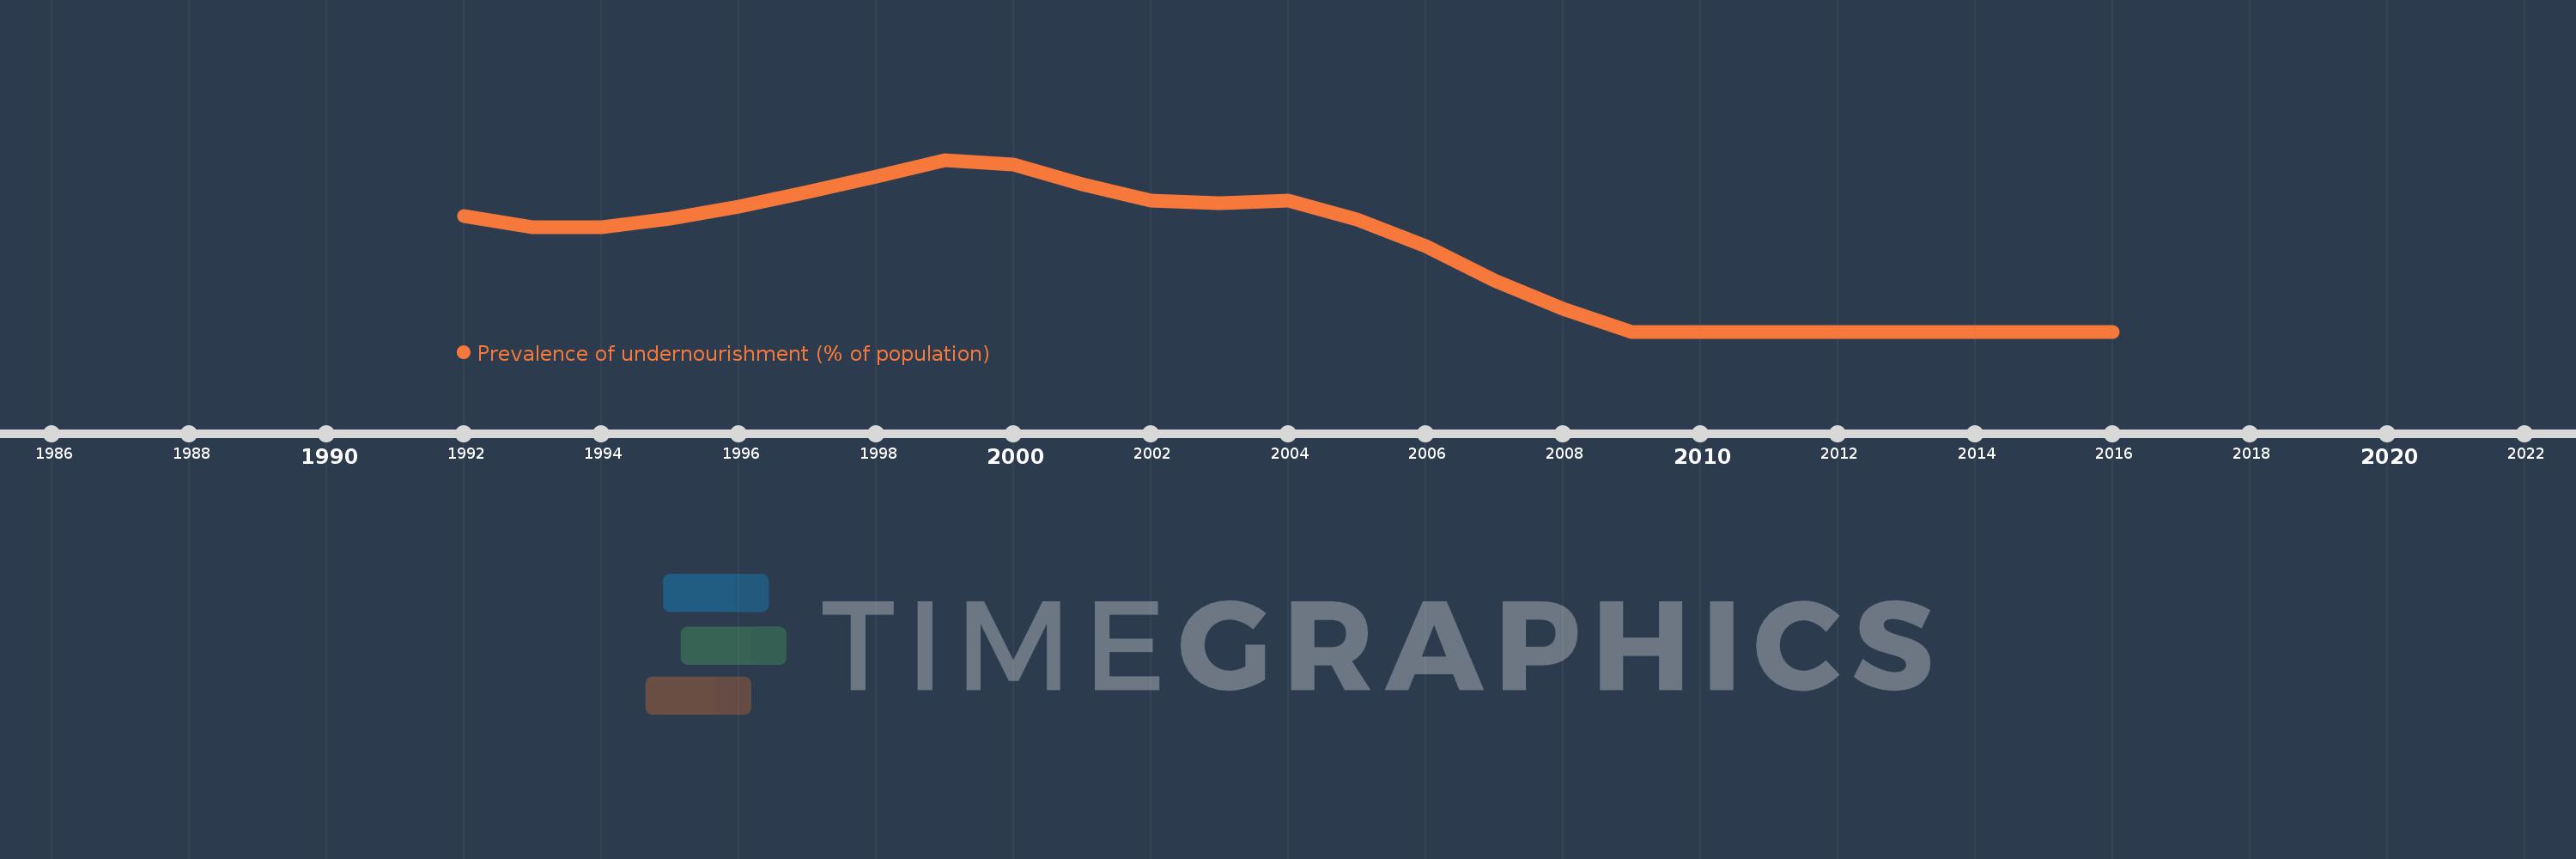
Prevalence of undernourishment (% of population)
2016,2015,2014,2013,2012,2011,2010,2009,2008,2007,2006,2005,2004,2003,2002,2001,2000,1999,1998,1997,1996,1995,1994,1993,1992
This statistics in other country:
Timeline:
This timeline shows a graph from 1992 to 2016 of Venezuela, RB. No data until 1991. Number of actual observations by date: 25.
Source name:
World Development Indicators
Source organization:
Food and Agriculture Organization (http://www.fao.org/publications/en/).
Categories, topics:
Health
Last updated:
apr 23, 2017
Indicators value changes by year
At the date of observation
Value
Absolute change
Change from previous value
jan 1, 1992
14.1
+14.1
0.0%
jan 1, 1993
13.2
-0.9
-6.38%
jan 1, 1995
13.9
+0.7
5.3%
jan 1, 1996
14.8
+0.9
6.47%
jan 1, 1997
16.0
+1.2
8.11%
jan 1, 1998
17.2
+1.2
7.5%
jan 1, 1999
18.5
+1.3
7.56%
jan 1, 2000
18.1
-0.4
-2.16%
jan 1, 2001
16.6
-1.5
-8.29%
jan 1, 2002
15.3
-1.3
-7.83%
jan 1, 2003
15.1
-0.2
-1.31%
jan 1, 2004
15.3
+0.2
1.32%
jan 1, 2005
13.8
-1.5
-9.8%
jan 1, 2006
11.7
-2.1
-15.22%
jan 1, 2007
9.0
-2.7
-23.08%
jan 1, 2008
6.8
-2.2
-24.44%
jan 1, 2009
5.0
-1.8
-26.47%
Ranking of countries by current statistics by years


Comments: