29
/
en
AIzaSyAYiBZKx7MnpbEhh9jyipgxe19OcubqV5w
April 1, 2024
40274
IDA total
IDA
false
2
1
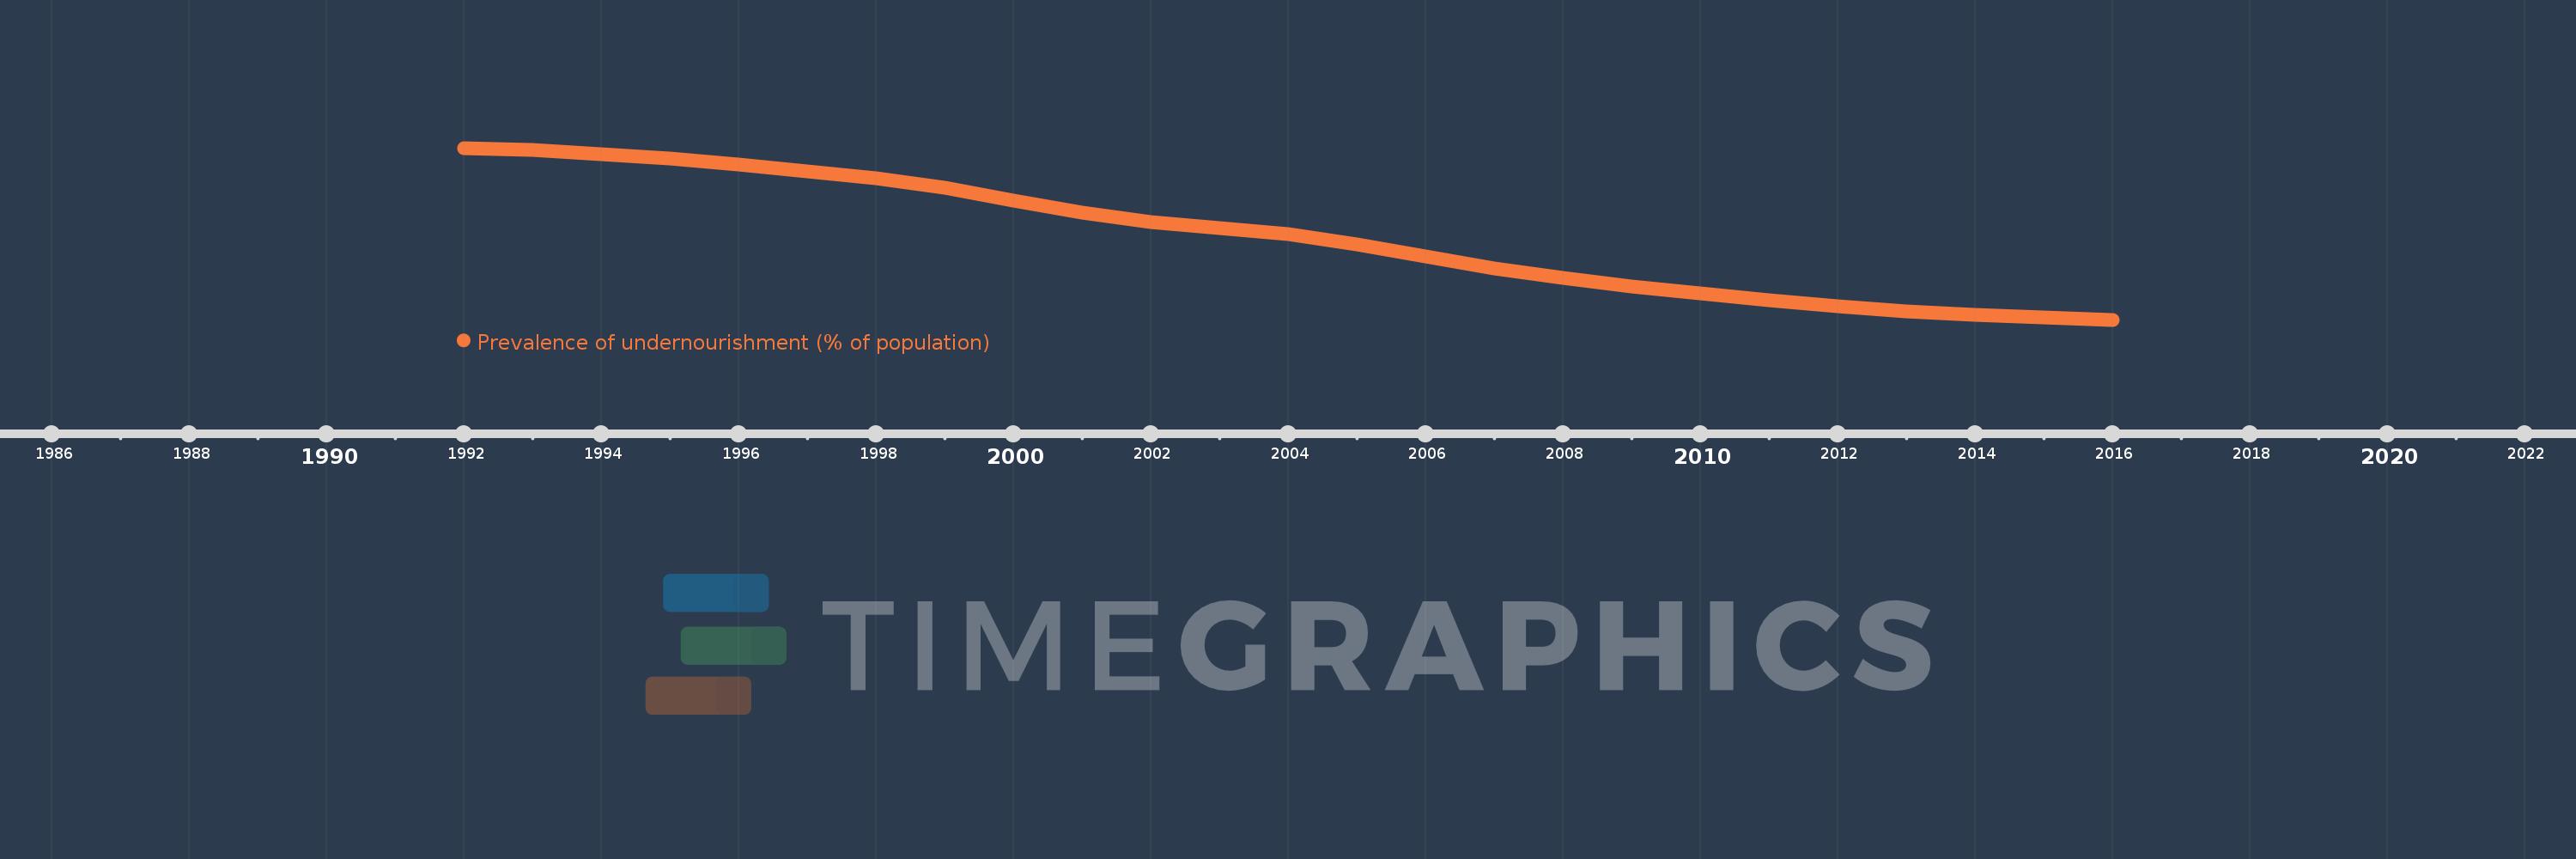
Prevalence of undernourishment (% of population)
2016,2015,2014,2013,2012,2011,2010,2009,2008,2007,2006,2005,2004,2003,2002,2001,2000,1999,1998,1997,1996,1995,1994,1993,1992
This statistics in other country:
Timeline:
This timeline shows a graph from 1992 to 2016 of IDA total. No data until 1991. Number of actual observations by date: 25.
Source name:
World Development Indicators
Source organization:
Food and Agriculture Organization (http://www.fao.org/publications/en/).
Categories, topics:
Health
Last updated:
apr 23, 2017
Indicators value changes by year
Minimum:
18.709
jan 1, 2016
Maximum:
34.656
jan 1, 1992
At the date of observation
Value
Absolute change
Change from previous value
jan 1, 1992
34.656
+34.656
0.0%
jan 1, 1993
34.471
-0.185
-0.53%
jan 1, 1994
34.036
-0.435
-1.26%
jan 1, 1995
33.694
-0.341
-1.0%
jan 1, 1996
33.11
-0.584
-1.73%
jan 1, 1997
32.519
-0.591
-1.79%
jan 1, 1998
31.823
-0.696
-2.14%
jan 1, 1999
30.962
-0.861
-2.71%
jan 1, 2000
29.797
-1.165
-3.76%
jan 1, 2001
28.641
-1.156
-3.88%
jan 1, 2002
27.804
-0.837
-2.92%
jan 1, 2003
27.241
-0.564
-2.03%
jan 1, 2004
26.628
-0.613
-2.25%
jan 1, 2005
25.665
-0.963
-3.62%
jan 1, 2006
24.587
-1.078
-4.2%
jan 1, 2007
23.482
-1.105
-4.5%
jan 1, 2008
22.56
-0.922
-3.92%
jan 1, 2009
21.782
-0.778
-3.45%
jan 1, 2010
21.138
-0.644
-2.96%
jan 1, 2011
20.503
-0.635
-3.0%
jan 1, 2012
19.95
-0.553
-2.7%
jan 1, 2013
19.493
-0.457
-2.29%
jan 1, 2014
19.186
-0.307
-1.58%
jan 1, 2015
18.947
-0.239
-1.25%
jan 1, 2016
18.709
-0.238
-1.26%
Ranking of countries by current statistics by years


Comments: