29
/
en
AIzaSyAYiBZKx7MnpbEhh9jyipgxe19OcubqV5w
April 1, 2024
28616
East Asia & Pacific (excluding high income)
EAP
false
2
1
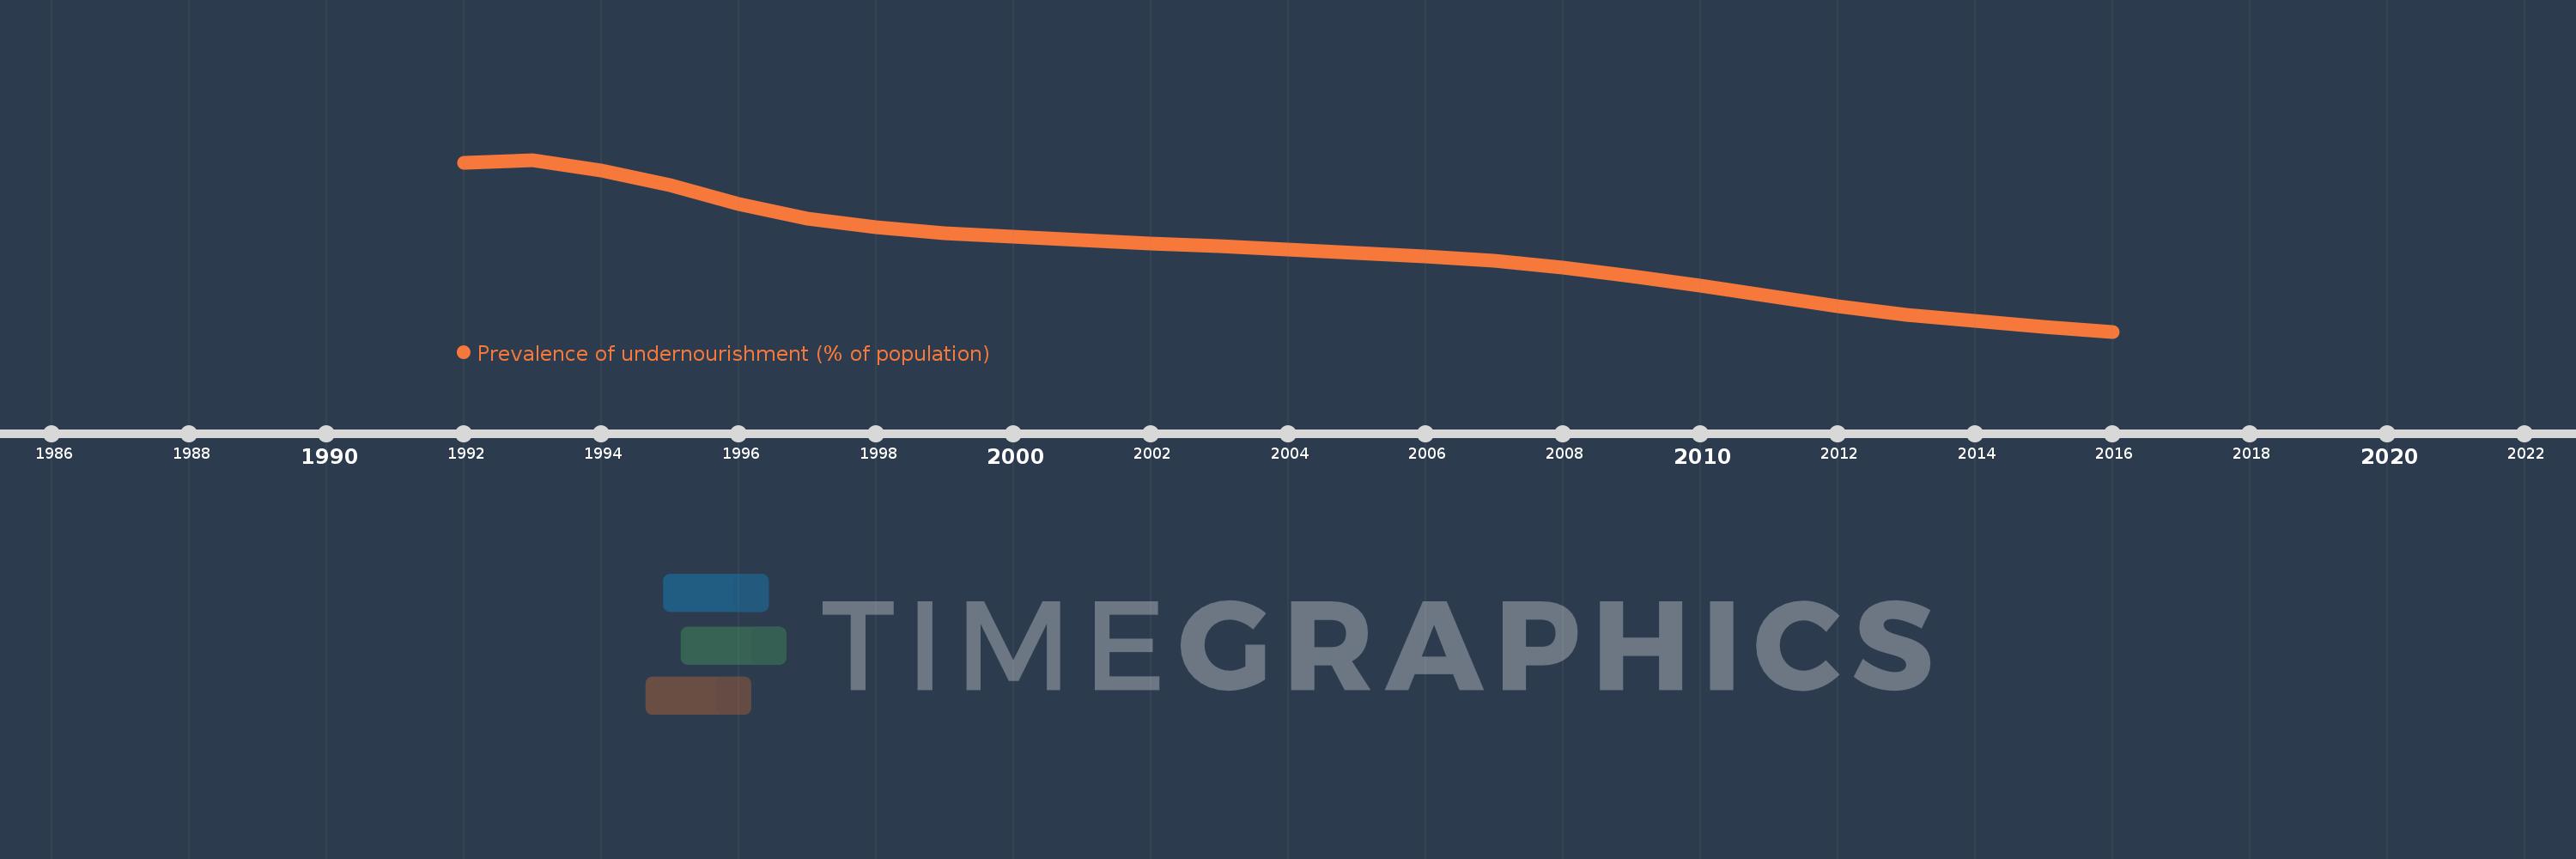
Prevalence of undernourishment (% of population)
2016,2015,2014,2013,2012,2011,2010,2009,2008,2007,2006,2005,2004,2003,2002,2001,2000,1999,1998,1997,1996,1995,1994,1993,1992
This statistics in other country:
Timeline:
This timeline shows a graph from 1992 to 2016 of East Asia & Pacific (excluding high income). No data until 1991. Number of actual observations by date: 25.
Source name:
World Development Indicators
Source organization:
Food and Agriculture Organization (http://www.fao.org/publications/en/).
Categories, topics:
Health
Last updated:
apr 23, 2017
Indicators value changes by year
Maximum:
25.993
jan 1, 1993
At the date of observation
Value
Absolute change
Change from previous value
jan 1, 1992
25.689
+25.689
0.0%
jan 1, 1993
25.993
+0.304
1.18%
jan 1, 1994
24.948
-1.045
-4.02%
jan 1, 1995
23.59
-1.358
-5.44%
jan 1, 1996
21.851
-1.739
-7.37%
jan 1, 1997
20.457
-1.393
-6.38%
jan 1, 1998
19.667
-0.791
-3.86%
jan 1, 1999
19.139
-0.528
-2.68%
jan 1, 2000
18.757
-0.382
-2.0%
jan 1, 2001
18.436
-0.321
-1.71%
jan 1, 2002
18.12
-0.316
-1.71%
jan 1, 2003
17.861
-0.26
-1.43%
jan 1, 2004
17.597
-0.263
-1.47%
jan 1, 2005
17.271
-0.327
-1.86%
jan 1, 2006
16.906
-0.364
-2.11%
jan 1, 2007
16.48
-0.426
-2.52%
jan 1, 2008
15.876
-0.604
-3.67%
jan 1, 2009
15.091
-0.784
-4.94%
jan 1, 2010
14.149
-0.943
-6.25%
jan 1, 2011
13.179
-0.969
-6.85%
jan 1, 2012
12.238
-0.941
-7.14%
jan 1, 2013
11.474
-0.764
-6.24%
jan 1, 2014
10.864
-0.61
-5.32%
jan 1, 2015
10.307
-0.557
-5.13%
jan 1, 2016
9.866
-0.441
-4.28%
Ranking of countries by current statistics by years


Comments: