29
/
en
AIzaSyAYiBZKx7MnpbEhh9jyipgxe19OcubqV5w
April 1, 2024
151005
Honduras
HND
true
2
1
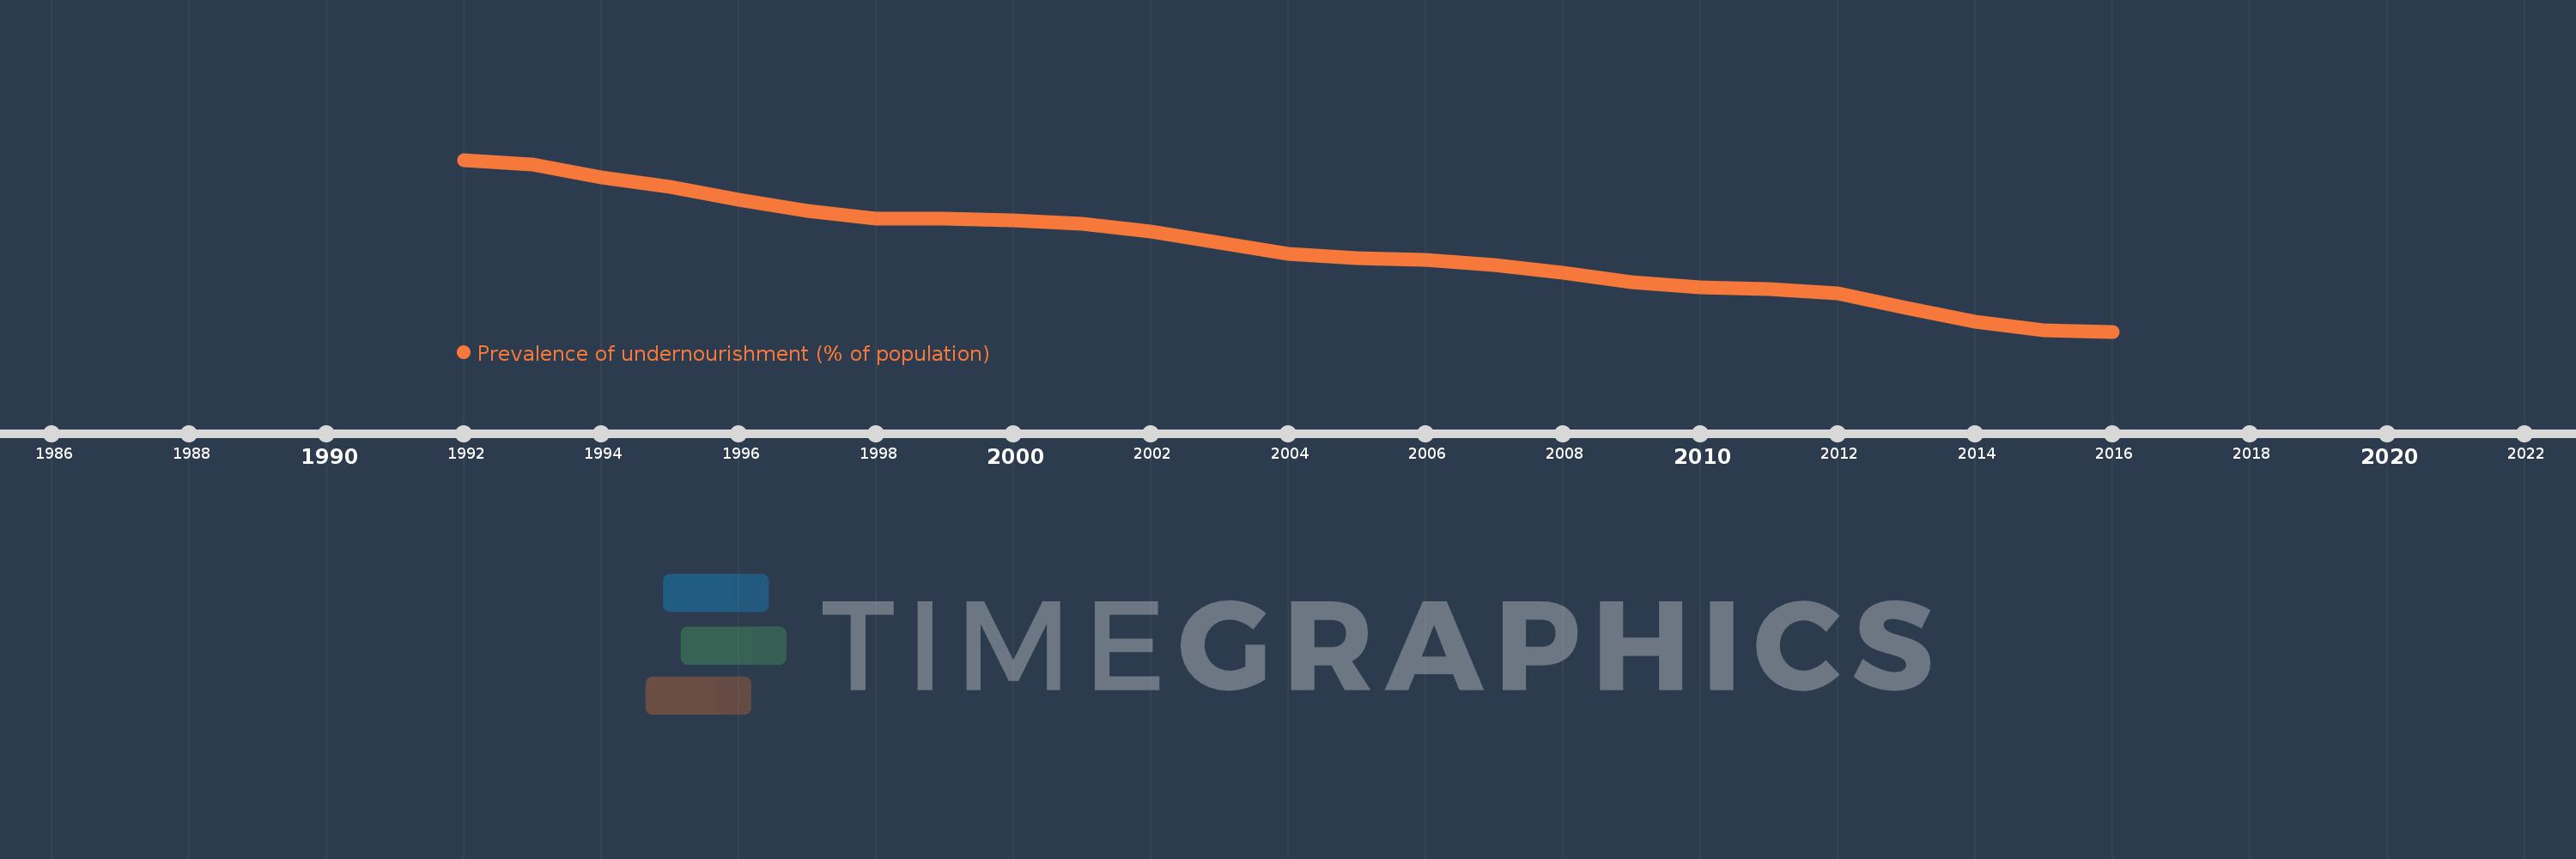
Prevalence of undernourishment (% of population)
2016,2015,2014,2013,2012,2011,2010,2009,2008,2007,2006,2005,2004,2003,2002,2001,2000,1999,1998,1997,1996,1995,1994,1993,1992
This statistics in other country:
Timeline:
This timeline shows a graph from 1992 to 2016 of Honduras. No data until 1991. Number of actual observations by date: 25.
Source name:
World Development Indicators
Source organization:
Food and Agriculture Organization (http://www.fao.org/publications/en/).
Categories, topics:
Health
Last updated:
apr 23, 2017
Indicators value changes by year
At the date of observation
Value
Absolute change
Change from previous value
jan 1, 1992
23.0
+23.0
0.0%
jan 1, 1993
22.7
-0.3
-1.3%
jan 1, 1994
21.9
-0.8
-3.52%
jan 1, 1995
21.3
-0.6
-2.74%
jan 1, 1996
20.5
-0.8
-3.76%
jan 1, 1997
19.8
-0.7
-3.41%
jan 1, 1998
19.3
-0.5
-2.53%
jan 1, 2000
19.2
-0.1
-0.52%
jan 1, 2001
19.0
-0.2
-1.04%
jan 1, 2002
18.5
-0.5
-2.63%
jan 1, 2003
17.8
-0.7
-3.78%
jan 1, 2004
17.1
-0.7
-3.93%
jan 1, 2005
16.8
-0.3
-1.75%
jan 1, 2006
16.7
-0.1
-0.6%
jan 1, 2007
16.4
-0.3
-1.8%
jan 1, 2008
15.9
-0.5
-3.05%
jan 1, 2009
15.3
-0.6
-3.77%
jan 1, 2010
15.0
-0.3
-1.96%
jan 1, 2011
14.9
-0.1
-0.67%
jan 1, 2012
14.6
-0.3
-2.01%
jan 1, 2013
13.7
-0.9
-6.16%
jan 1, 2014
12.8
-0.9
-6.57%
jan 1, 2015
12.3
-0.5
-3.91%
jan 1, 2016
12.2
-0.1
-0.81%
Ranking of countries by current statistics by years


Comments: