29
/
en
AIzaSyAYiBZKx7MnpbEhh9jyipgxe19OcubqV5w
April 1, 2024
35316
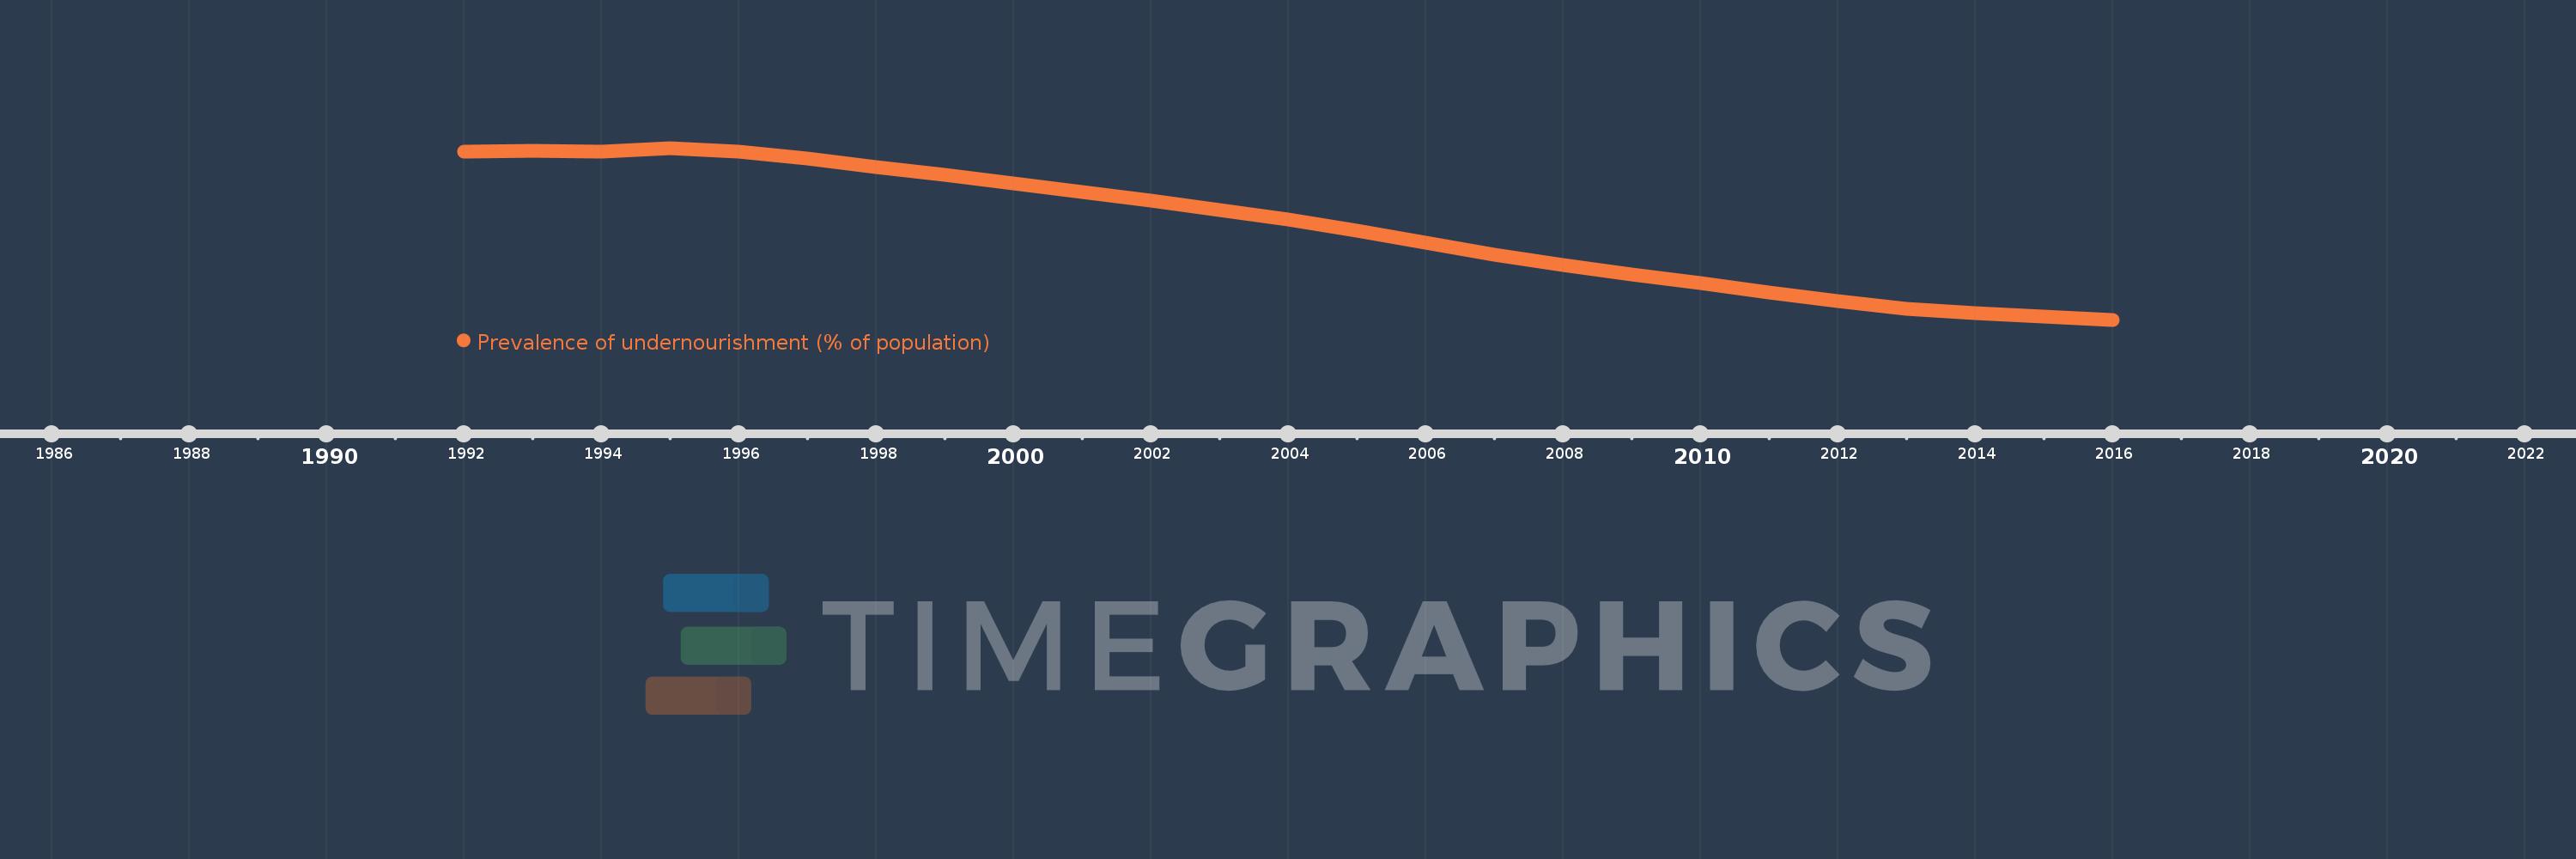
Heavily indebted poor countries (HIPC)
HPC
false
2
1
Prevalence of undernourishment (% of population)
2016,2015,2014,2013,2012,2011,2010,2009,2008,2007,2006,2005,2004,2003,2002,2001,2000,1999,1998,1997,1996,1995,1994,1993,1992
This statistics in other country:
Timeline:
This timeline shows a graph from 1992 to 2016 of Heavily indebted poor countries (HIPC). No data until 1991. Number of actual observations by date: 25.
Source name:
World Development Indicators
Source organization:
Food and Agriculture Organization (http://www.fao.org/publications/en/).
Categories, topics:
Health
Last updated:
apr 23, 2017
Indicators value changes by year
Minimum:
23.944
jan 1, 2016
Maximum:
41.003
jan 1, 1995
At the date of observation
Value
Absolute change
Change from previous value
jan 1, 1992
40.615
+40.615
0.0%
jan 1, 1993
40.702
+0.087
0.21%
jan 1, 1994
40.674
-0.028
-0.07%
jan 1, 1995
41.003
+0.329
0.81%
jan 1, 1996
40.642
-0.362
-0.88%
jan 1, 1997
39.992
-0.649
-1.6%
jan 1, 1998
39.136
-0.856
-2.14%
jan 1, 1999
38.363
-0.774
-1.98%
jan 1, 2000
37.479
-0.884
-2.3%
jan 1, 2001
36.616
-0.863
-2.3%
jan 1, 2002
35.74
-0.876
-2.39%
jan 1, 2003
34.873
-0.868
-2.43%
jan 1, 2004
33.9
-0.973
-2.79%
jan 1, 2005
32.749
-1.151
-3.4%
jan 1, 2006
31.594
-1.154
-3.52%
jan 1, 2007
30.416
-1.179
-3.73%
jan 1, 2008
29.397
-1.019
-3.35%
jan 1, 2009
28.48
-0.917
-3.12%
jan 1, 2010
27.606
-0.874
-3.07%
jan 1, 2011
26.686
-0.92
-3.33%
jan 1, 2012
25.809
-0.877
-3.29%
jan 1, 2013
25.059
-0.75
-2.91%
jan 1, 2014
24.565
-0.494
-1.97%
jan 1, 2015
24.25
-0.315
-1.28%
jan 1, 2016
23.944
-0.306
-1.26%
Ranking of countries by current statistics by years


Comments: