29
/
en
AIzaSyAYiBZKx7MnpbEhh9jyipgxe19OcubqV5w
April 1, 2024
36931
IBRD only
IBD
false
2
1
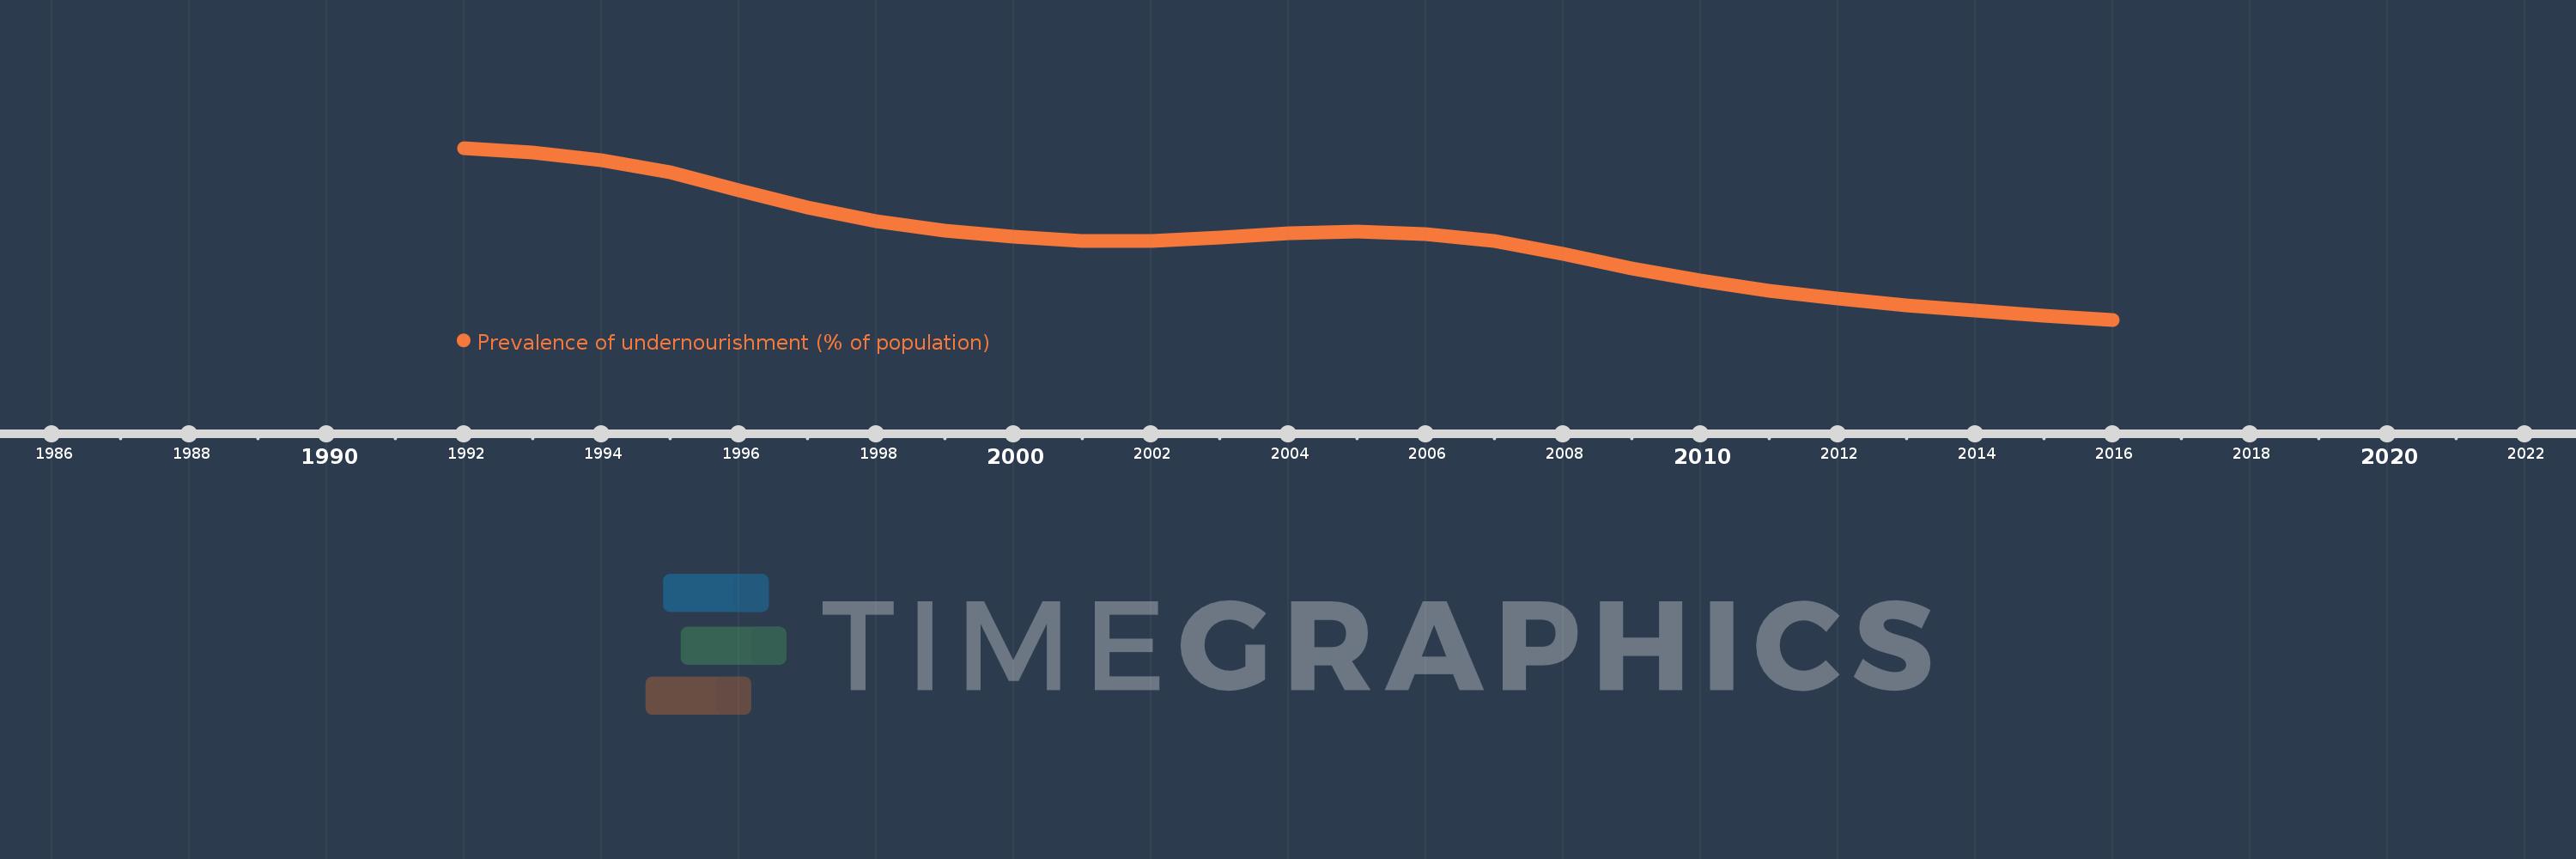
Prevalence of undernourishment (% of population)
2016,2015,2014,2013,2012,2011,2010,2009,2008,2007,2006,2005,2004,2003,2002,2001,2000,1999,1998,1997,1996,1995,1994,1993,1992
This statistics in other country:
Timeline:
This timeline shows a graph from 1992 to 2016 of IBRD only. No data until 1991. Number of actual observations by date: 25.
Source name:
World Development Indicators
Source organization:
Food and Agriculture Organization (http://www.fao.org/publications/en/).
Categories, topics:
Health
Last updated:
apr 23, 2017
Indicators value changes by year
Minimum:
10.371
jan 1, 2016
Maximum:
20.705
jan 1, 1992
At the date of observation
Value
Absolute change
Change from previous value
jan 1, 1992
20.705
+20.705
0.0%
jan 1, 1993
20.436
-0.269
-1.3%
jan 1, 1994
19.976
-0.46
-2.25%
jan 1, 1995
19.241
-0.734
-3.68%
jan 1, 1996
18.181
-1.061
-5.51%
jan 1, 1997
17.117
-1.064
-5.85%
jan 1, 1998
16.303
-0.814
-4.76%
jan 1, 1999
15.71
-0.593
-3.64%
jan 1, 2000
15.352
-0.358
-2.28%
jan 1, 2001
15.126
-0.226
-1.47%
jan 1, 2002
15.118
-0.009
-0.06%
jan 1, 2003
15.296
+0.178
1.18%
jan 1, 2004
15.551
+0.255
1.67%
jan 1, 2005
15.659
+0.109
0.7%
jan 1, 2006
15.539
-0.12
-0.77%
jan 1, 2007
15.119
-0.42
-2.7%
jan 1, 2008
14.339
-0.78
-5.16%
jan 1, 2009
13.452
-0.886
-6.18%
jan 1, 2010
12.714
-0.739
-5.49%
jan 1, 2011
12.116
-0.598
-4.7%
jan 1, 2012
11.643
-0.473
-3.91%
jan 1, 2013
11.212
-0.431
-3.7%
jan 1, 2014
10.916
-0.295
-2.63%
jan 1, 2015
10.607
-0.309
-2.83%
jan 1, 2016
10.371
-0.236
-2.23%
Ranking of countries by current statistics by years


Comments: