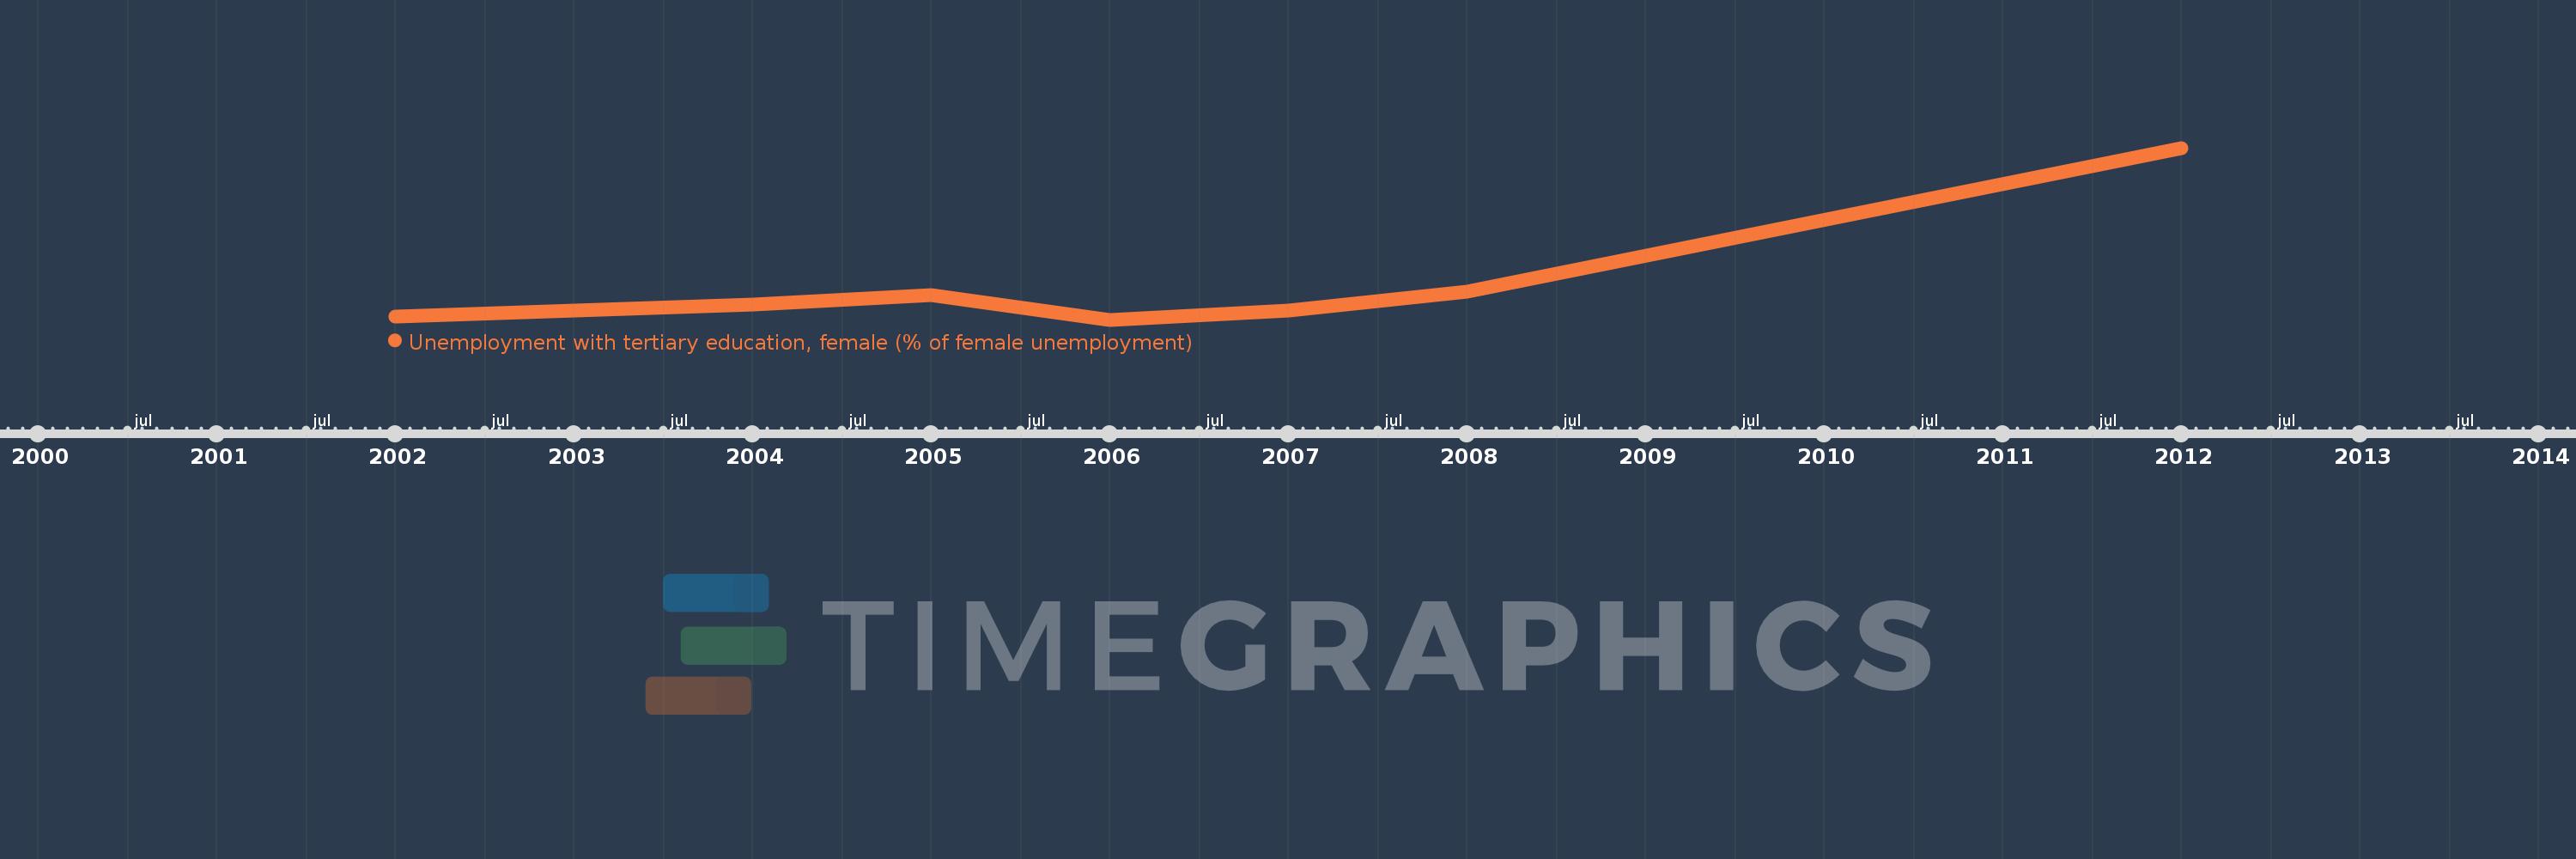
This timeline shows a graph from 2002 to 2012 of Latin America & Caribbean (excluding high income). No data until 2001. Number of actual observations by date: 8.
Source name:
World Development Indicators
Source organization:
International Labour Organization, Key Indicators of the Labour Market database.
Categories, topics:
Social Protection & Labor, Gender
Last updated:
apr 23, 2017
Indicators value changes by year
Meaning:
12.945
Minimum:
11.046
jan 1, 2006
Maximum:
21.017
jan 1, 2012
At the date of observation
Value
Absolute change
Change from the previous value
jan 1, 2002
11.227
+11.227
0.0%
jan 1, 2003
11.596
+0.369
3.29%
jan 1, 2004
11.929
+0.333
2.87%
jan 1, 2005
12.489
+0.56
4.7%
jan 1, 2006
11.046
-1.443
-11.56%
jan 1, 2007
11.557
+0.512
4.63%
jan 1, 2008
12.694
+1.137
9.84%
jan 1, 2012
21.017
+8.323
65.57%
Ranking of countries by current statistics by years
