29
/
en
AIzaSyAYiBZKx7MnpbEhh9jyipgxe19OcubqV5w
April 1, 2024
32307
Europe & Central Asia (excluding high income)
ECA
false
2
1
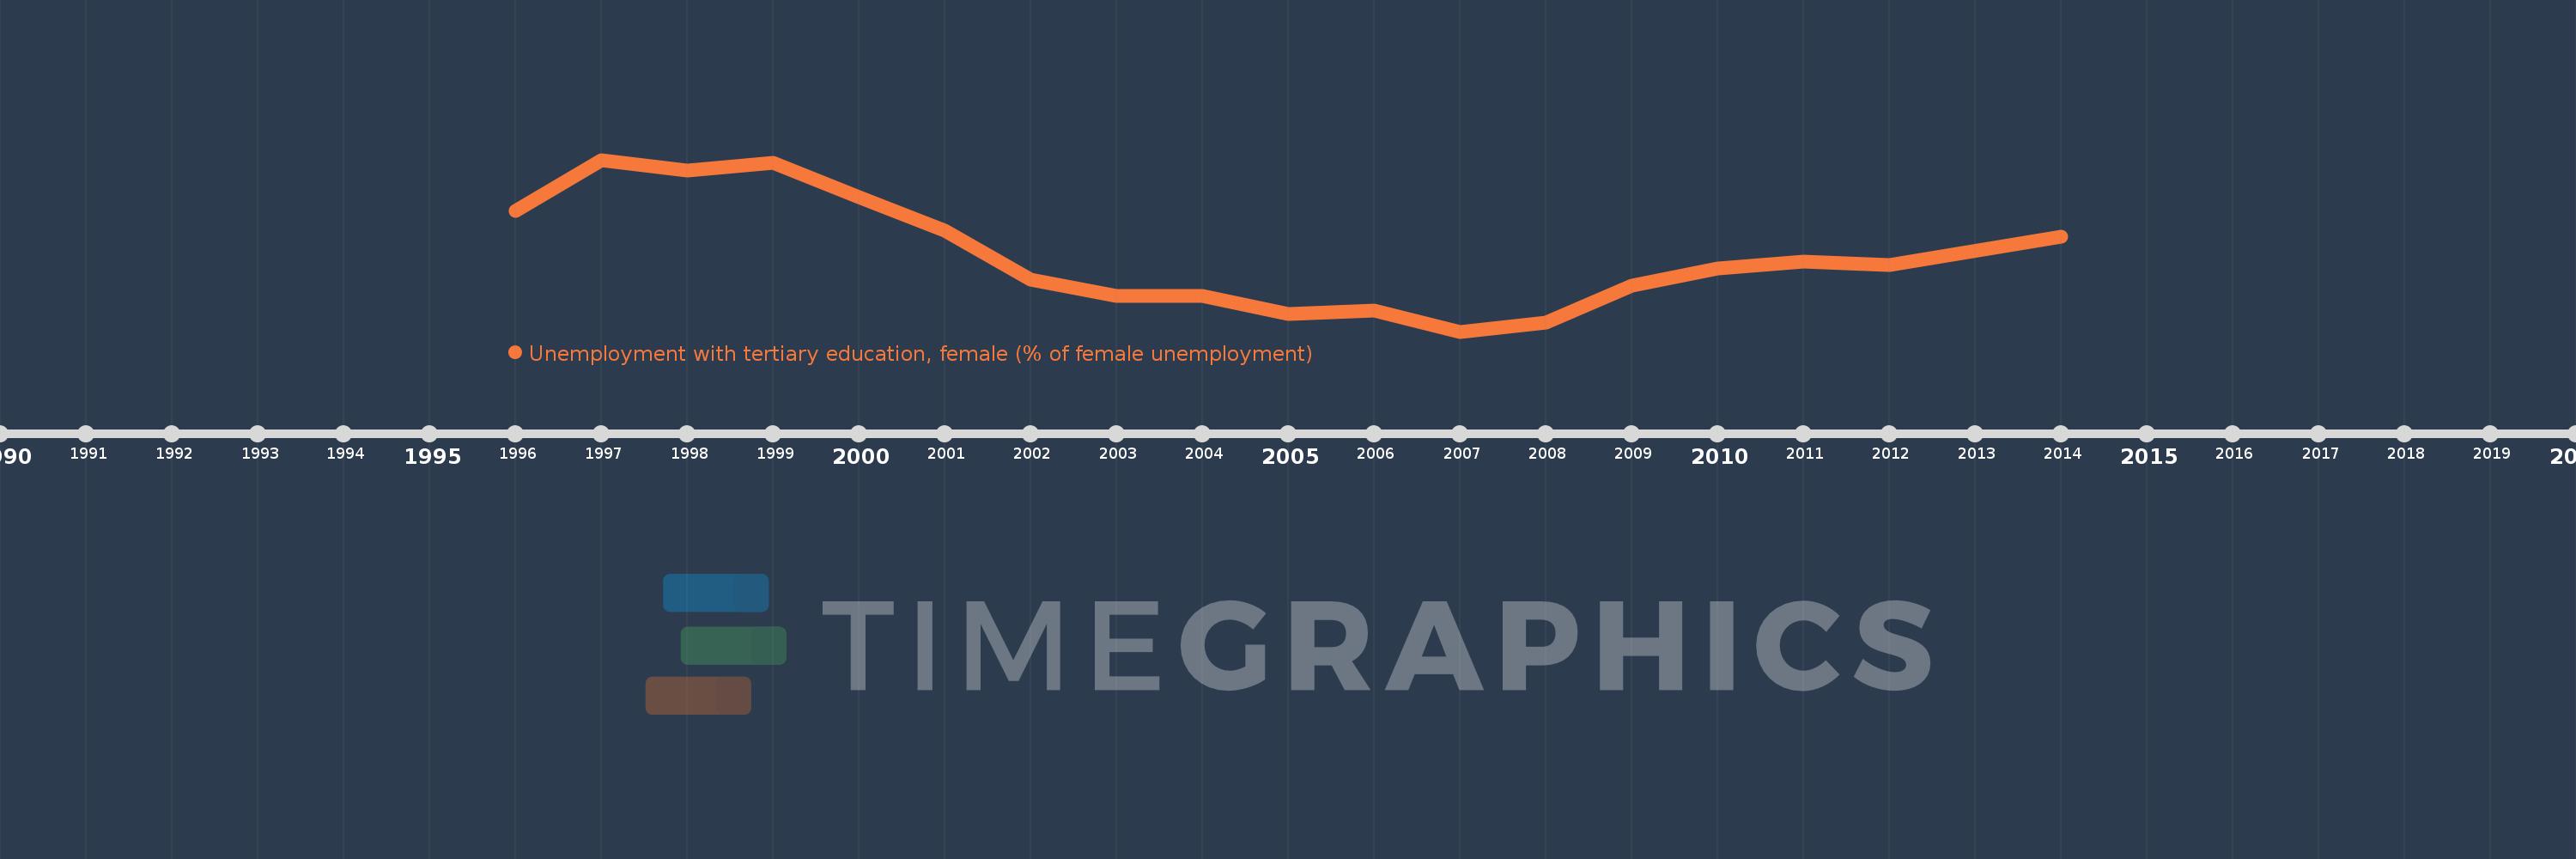
Unemployment with tertiary education, female (% of female unemployment)
2014,2012,2011,2010,2009,2008,2007,2006,2005,2004,2003,2002,2001,2000,1999,1998,1997,1996
This statistics in other country:
Timeline:
This timeline shows a graph from 1996 to 2014 of Europe & Central Asia (excluding high income). No data until 1995. Number of actual observations by date: 18.
Source name:
World Development Indicators
Source organization:
International Labour Organization, Key Indicators of the Labour Market database.
Categories, topics:
Social Protection & Labor, Gender
Last updated:
apr 23, 2017
Indicators value changes by year
Minimum:
30.007
jan 1, 2007
Maximum:
43.857
jan 1, 1997
At the date of observation
Value
Absolute change
Change from previous value
jan 1, 1996
39.747
+39.747
0.0%
jan 1, 1997
43.857
+4.11
10.34%
jan 1, 1998
43.002
-0.854
-1.95%
jan 1, 1999
43.588
+0.586
1.36%
jan 1, 2000
40.818
-2.77
-6.35%
jan 1, 2001
38.172
-2.646
-6.48%
jan 1, 2002
34.167
-4.005
-10.49%
jan 1, 2003
32.875
-1.292
-3.78%
jan 1, 2004
32.903
+0.028
0.08%
jan 1, 2005
31.43
-1.472
-4.48%
jan 1, 2006
31.696
+0.266
0.85%
jan 1, 2007
30.007
-1.69
-5.33%
jan 1, 2008
30.7
+0.693
2.31%
jan 1, 2009
33.704
+3.004
9.78%
jan 1, 2010
35.085
+1.381
4.1%
jan 1, 2011
35.682
+0.597
1.7%
jan 1, 2012
35.383
-0.299
-0.84%
jan 1, 2014
37.644
+2.262
6.39%
Ranking of countries by current statistics by years


Comments: