29
/
en
AIzaSyAYiBZKx7MnpbEhh9jyipgxe19OcubqV5w
April 1, 2024
268834
Tunisia
TUN
true
2
1
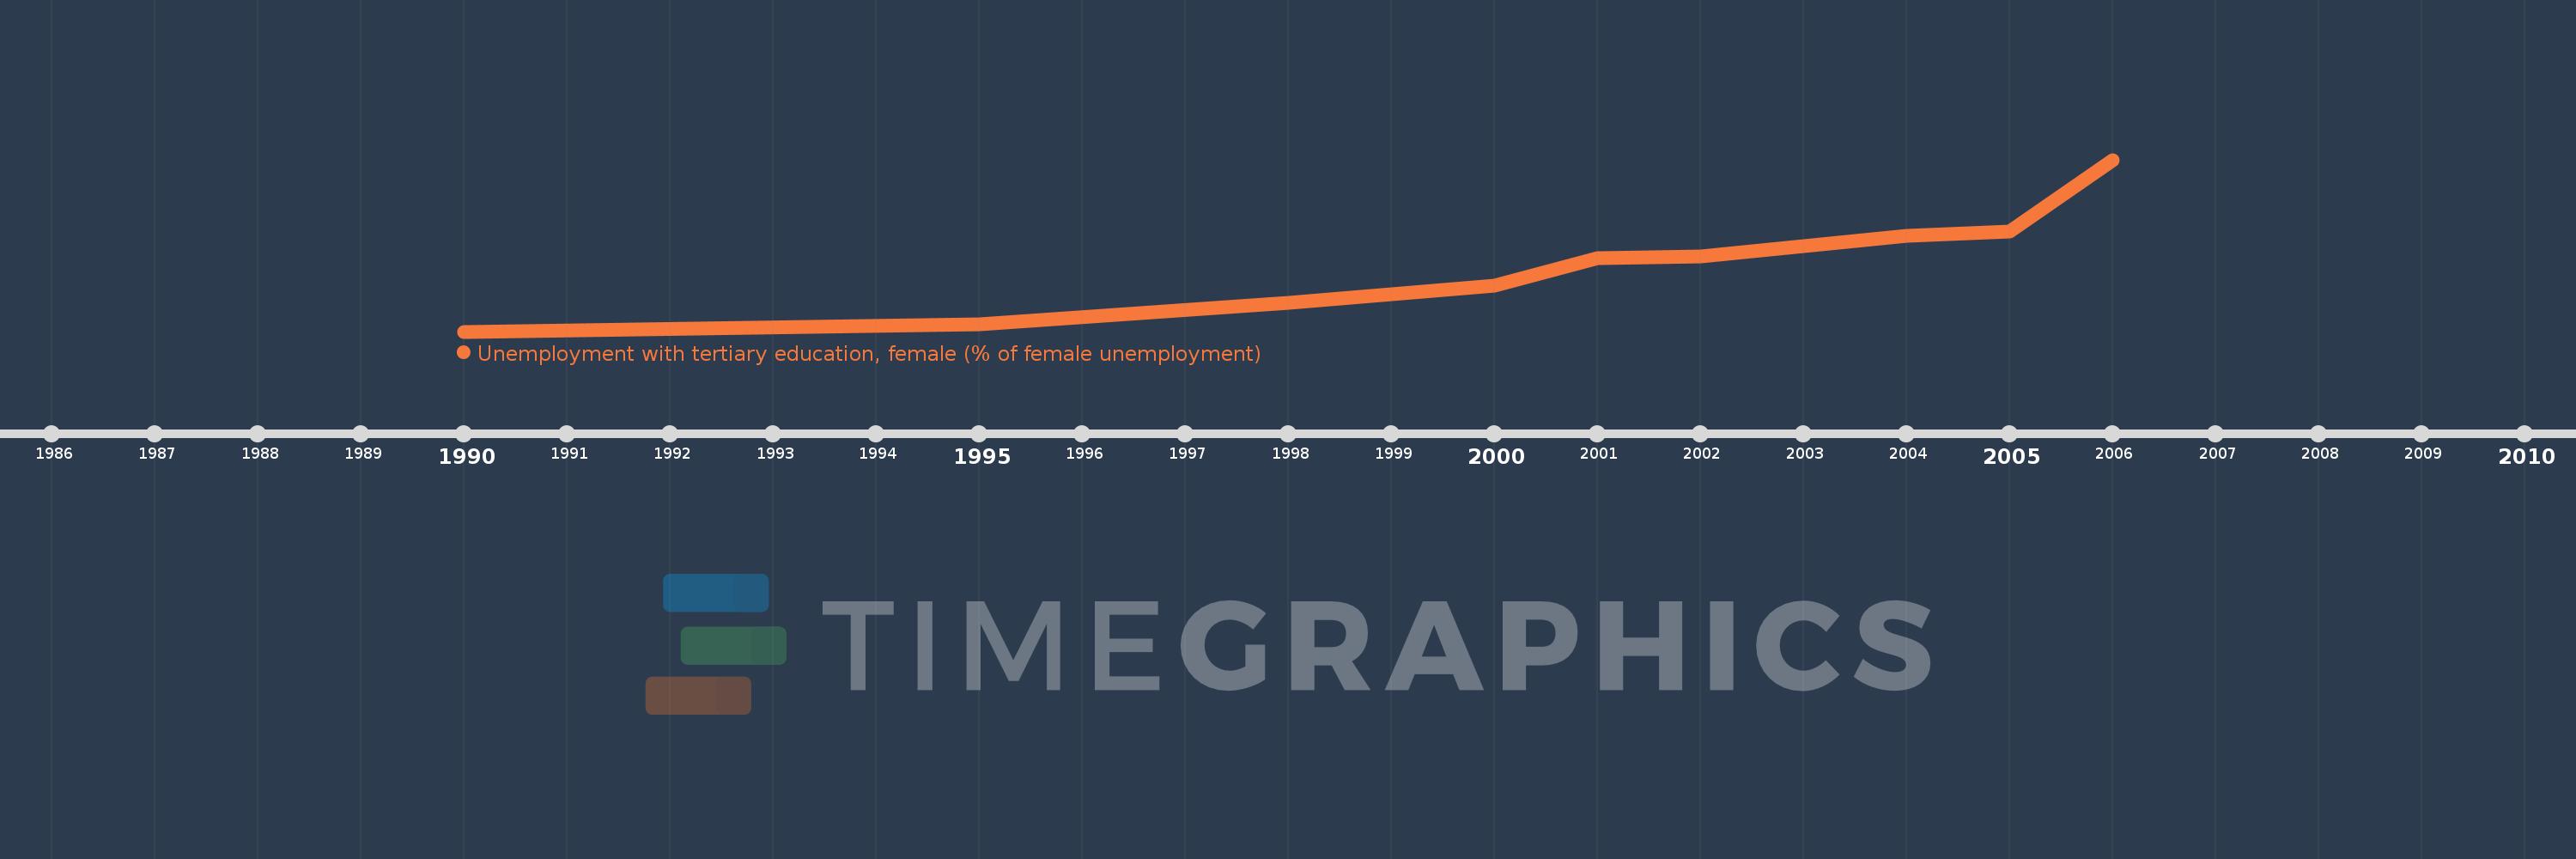
Unemployment with tertiary education, female (% of female unemployment)
2006,2005,2004,2003,2002,2001,2000,1998,1995,1990
This statistics in other country:
Timeline:
This timeline shows a graph from 1990 to 2006 of Tunisia. No data until 1989. Number of actual observations by date: 10.
Source name:
World Development Indicators
Source organization:
International Labour Organization, Key Indicators of the Labour Market database.
Categories, topics:
Social Protection & Labor, Gender
Last updated:
apr 23, 2017
Indicators value changes by year
At the date of observation
Value
Absolute change
Change from previous value
jan 1, 1995
2.4
+0.9
60.0%
jan 1, 1998
5.1
+2.7
112.5%
jan 1, 2000
7.3
+2.2
43.14%
jan 1, 2001
10.8
+3.5
47.95%
jan 1, 2002
11.0
+0.2
1.85%
jan 1, 2003
12.3
+1.3
11.82%
jan 1, 2004
13.7
+1.4
11.38%
jan 1, 2005
14.2
+0.5
3.65%
jan 1, 2006
23.3
+9.1
64.08%
Ranking of countries by current statistics by years


Comments: