29
/
en
AIzaSyAYiBZKx7MnpbEhh9jyipgxe19OcubqV5w
April 1, 2024
33963
European Union
EUU
false
2
1
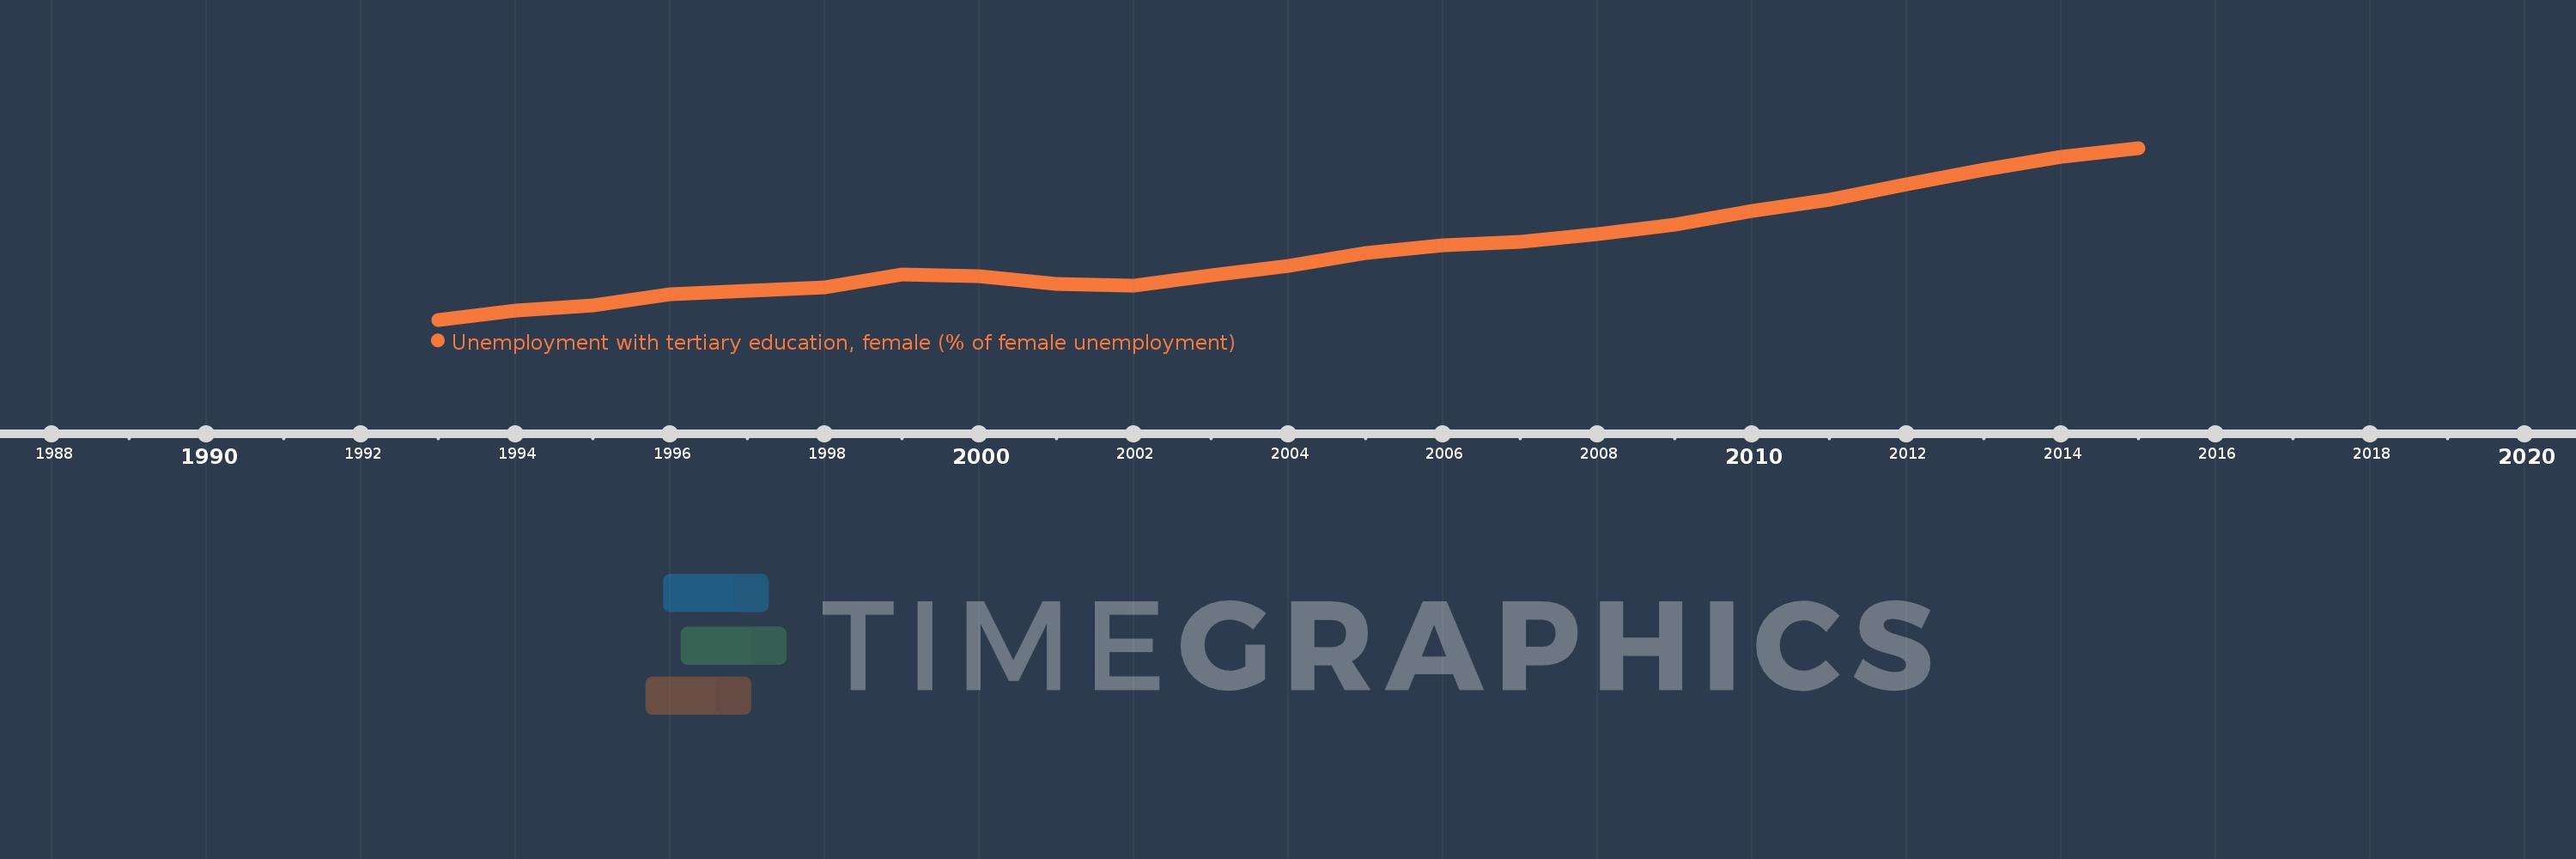
Unemployment with tertiary education, female (% of female unemployment)
2015,2014,2013,2012,2011,2010,2009,2008,2007,2006,2005,2004,2003,2002,2001,2000,1999,1998,1997,1996,1995,1994,1993
This statistics in other country:
Timeline:
This timeline shows a graph from 1993 to 2015 of European Union. No data until 1992. Number of actual observations by date: 23.
Source name:
World Development Indicators
Source organization:
International Labour Organization, Key Indicators of the Labour Market database.
Categories, topics:
Social Protection & Labor, Gender
Last updated:
apr 23, 2017
Indicators value changes by year
Maximum:
22.376
jan 1, 2015
At the date of observation
Value
Absolute change
Change from previous value
jan 1, 1993
9.222
+9.222
0.0%
jan 1, 1994
9.929
+0.707
7.67%
jan 1, 1995
10.335
+0.406
4.09%
jan 1, 1996
11.147
+0.812
7.85%
jan 1, 1997
11.416
+0.269
2.41%
jan 1, 1998
11.722
+0.306
2.68%
jan 1, 1999
12.667
+0.945
8.06%
jan 1, 2000
12.531
-0.136
-1.07%
jan 1, 2001
11.99
-0.54
-4.31%
jan 1, 2002
11.81
-0.181
-1.51%
jan 1, 2003
12.649
+0.839
7.1%
jan 1, 2004
13.378
+0.729
5.76%
jan 1, 2005
14.362
+0.984
7.36%
jan 1, 2006
14.933
+0.572
3.98%
jan 1, 2007
15.218
+0.284
1.9%
jan 1, 2008
15.748
+0.53
3.49%
jan 1, 2009
16.481
+0.733
4.66%
jan 1, 2010
17.579
+1.098
6.66%
jan 1, 2011
18.387
+0.808
4.59%
jan 1, 2012
19.562
+1.176
6.39%
jan 1, 2013
20.723
+1.161
5.93%
jan 1, 2014
21.683
+0.96
4.63%
jan 1, 2015
22.376
+0.693
3.2%
Ranking of countries by current statistics by years


Comments: