29
/
en
AIzaSyAYiBZKx7MnpbEhh9jyipgxe19OcubqV5w
April 1, 2024
229315
Romania
ROU
true
2
1
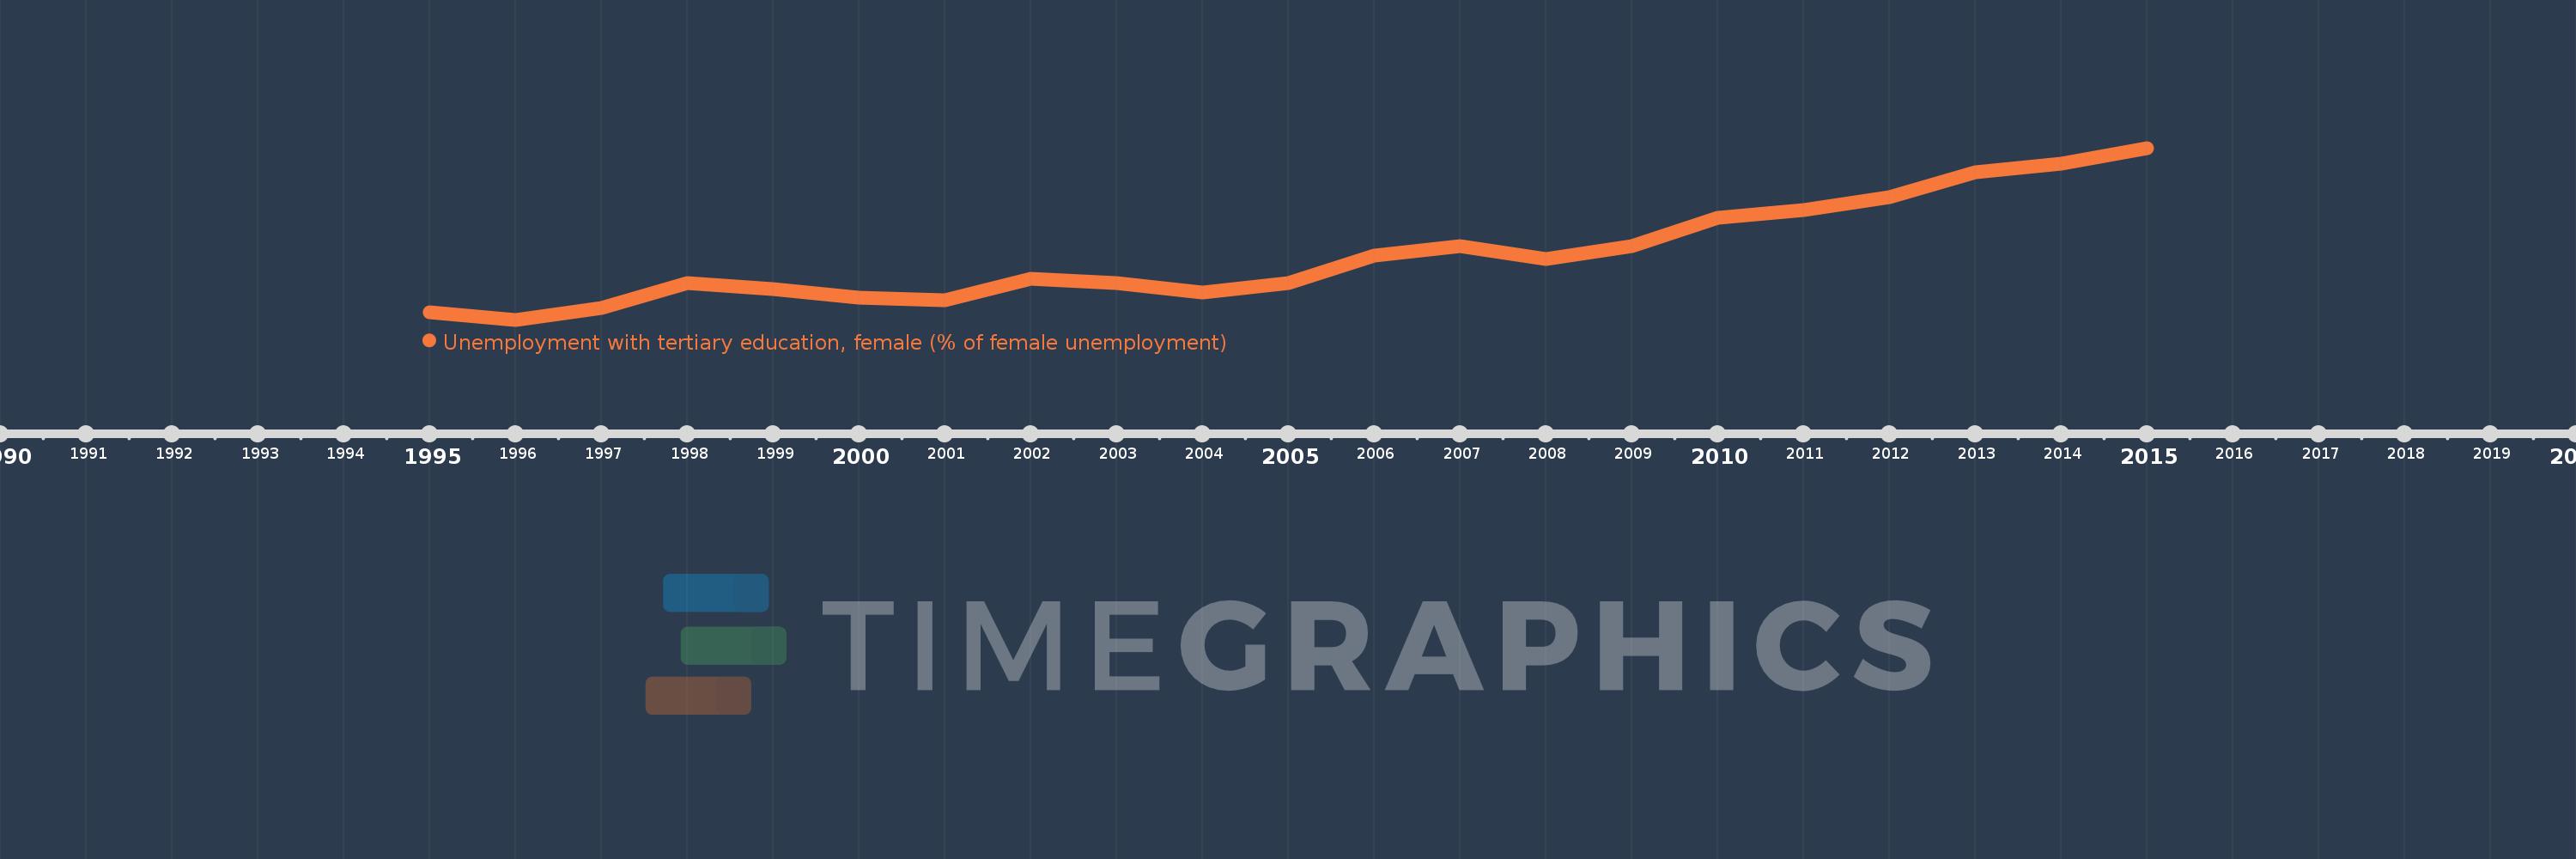
Unemployment with tertiary education, female (% of female unemployment)
2015,2014,2013,2012,2011,2010,2009,2008,2007,2006,2005,2004,2003,2002,2001,2000,1999,1998,1997,1996,1995
This statistics in other country:
Timeline:
This timeline shows a graph from 1995 to 2015 of Romania. No data until 1994. Number of actual observations by date: 21.
Source name:
World Development Indicators
Source organization:
International Labour Organization, Key Indicators of the Labour Market database.
Categories, topics:
Social Protection & Labor, Gender
Last updated:
apr 23, 2017
Indicators value changes by year
At the date of observation
Value
Absolute change
Change from previous value
jan 1, 1996
1.7
-0.8
-32.0%
jan 1, 1997
3.0
+1.3
76.47%
jan 1, 1998
5.7
+2.7
90.0%
jan 1, 1999
5.1
-0.6
-10.53%
jan 1, 2000
4.1
-1.0
-19.61%
jan 1, 2001
3.8
-0.3
-7.32%
jan 1, 2002
6.2
+2.4
63.16%
jan 1, 2003
5.7
-0.5
-8.06%
jan 1, 2004
4.7
-1.0
-17.54%
jan 1, 2005
5.7
+1.0
21.28%
jan 1, 2006
8.7
+3.0
52.63%
jan 1, 2007
9.8
+1.1
12.64%
jan 1, 2008
8.3
-1.5
-15.31%
jan 1, 2009
9.8
+1.5
18.07%
jan 1, 2010
12.9
+3.1
31.63%
jan 1, 2011
13.7
+0.8
6.2%
jan 1, 2012
15.1
+1.4
10.22%
jan 1, 2013
17.8
+2.7
17.88%
jan 1, 2014
18.8
+1.0
5.62%
jan 1, 2015
20.5
+1.7
9.04%
Ranking of countries by current statistics by years


Comments: