29
/
en
AIzaSyAYiBZKx7MnpbEhh9jyipgxe19OcubqV5w
April 1, 2024
241067
Singapore
SGP
true
2
1
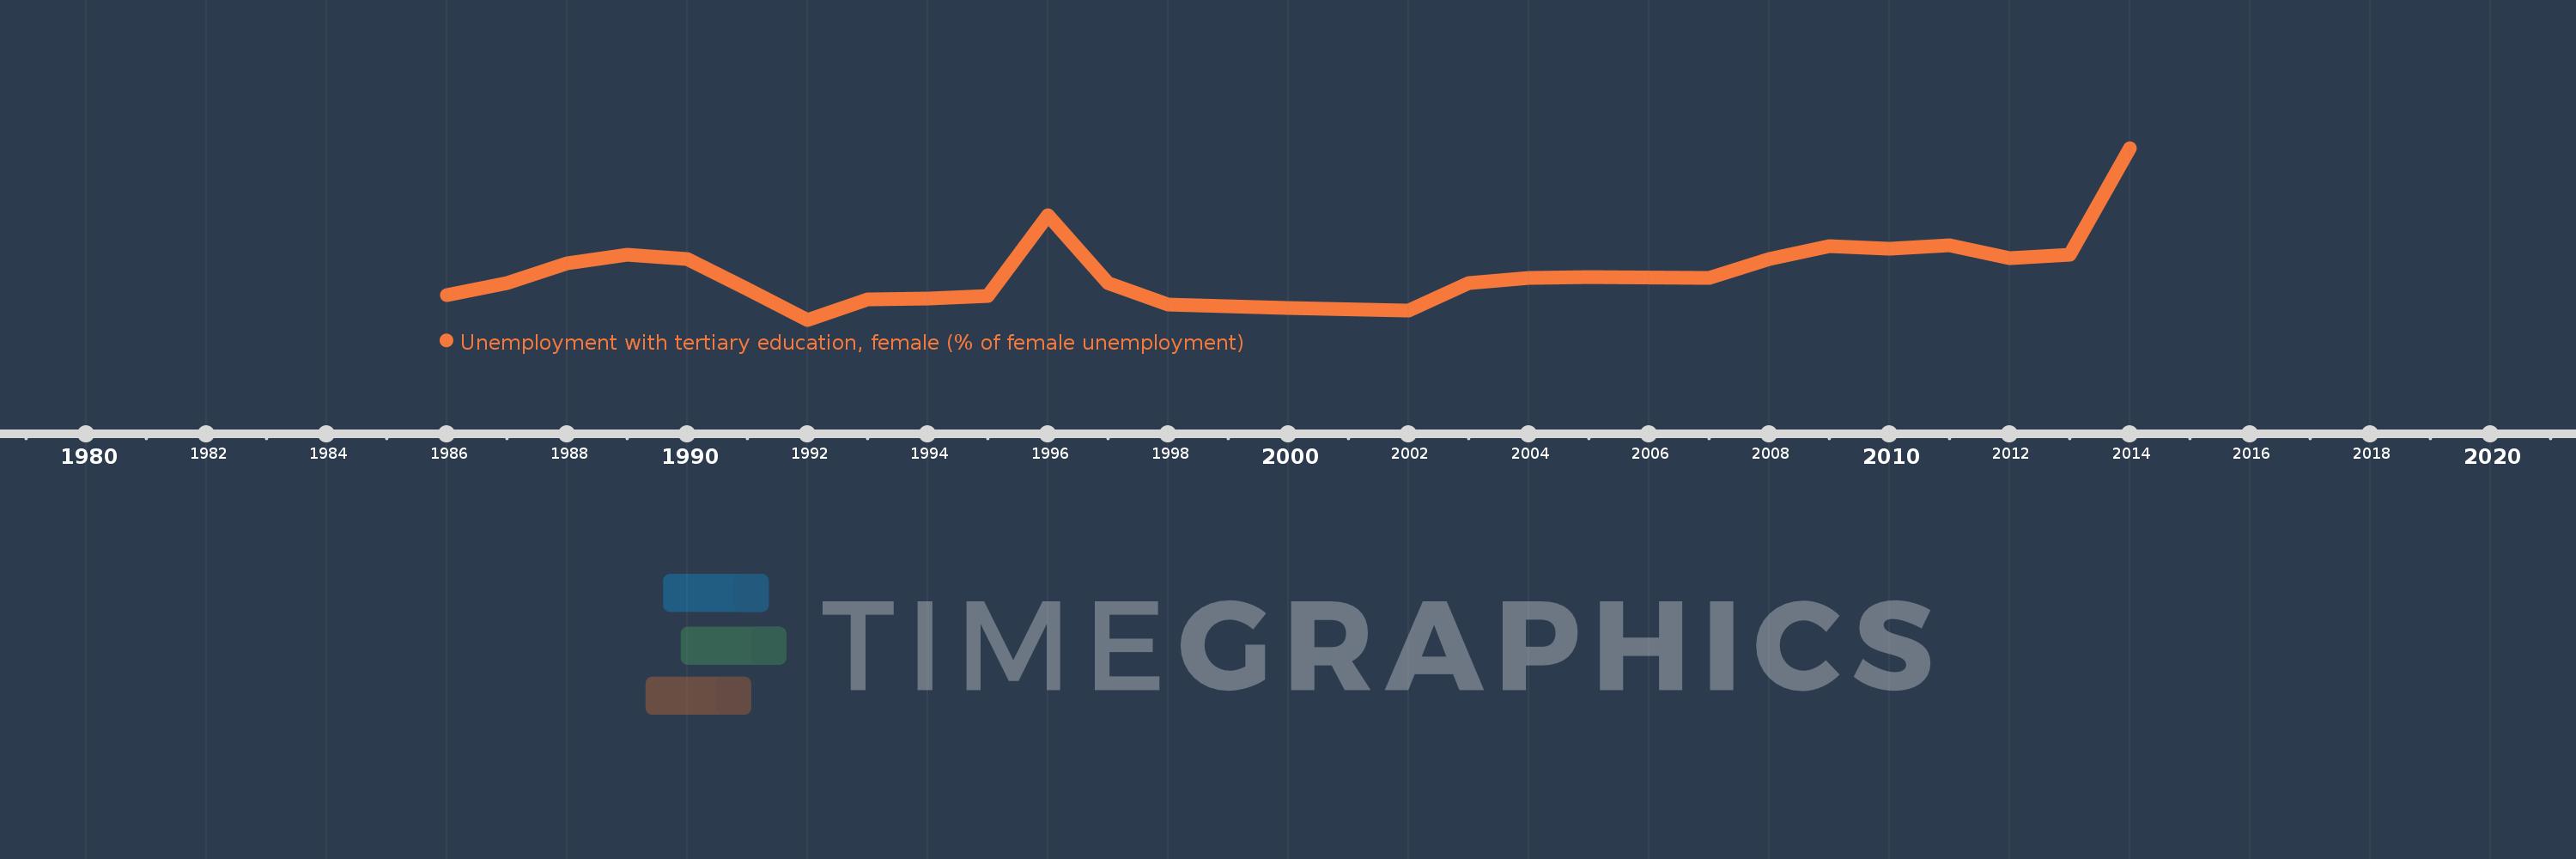
Unemployment with tertiary education, female (% of female unemployment)
2014,2013,2012,2011,2010,2009,2008,2007,2005,2004,2003,2002,2000,1999,1998,1997,1996,1995,1994,1993,1992,1991,1990,1989,1988,1987,1986
This statistics in other country:
Timeline:
This timeline shows a graph from 1986 to 2014 of Singapore. No data until 1985. Number of actual observations by date: 27.
Source name:
World Development Indicators
Source organization:
International Labour Organization, Key Indicators of the Labour Market database.
Categories, topics:
Social Protection & Labor, Gender
Last updated:
apr 23, 2017
Indicators value changes by year
At the date of observation
Value
Absolute change
Change from previous value
jan 1, 1986
16.8
+16.8
0.0%
jan 1, 1987
19.5
+2.7
16.07%
jan 1, 1988
24.1
+4.6
23.59%
jan 1, 1989
26.1
+2.0
8.3%
jan 1, 1990
25.0
-1.1
-4.21%
jan 1, 1991
18.3
-6.7
-26.8%
jan 1, 1992
11.2
-7.1
-38.8%
jan 1, 1993
15.8
+4.6
41.07%
jan 1, 1994
16.0
+0.2
1.27%
jan 1, 1995
16.7
+0.7
4.38%
jan 1, 1996
35.1
+18.4
110.18%
jan 1, 1997
19.6
-15.5
-44.16%
jan 1, 1998
14.6
-5.0
-25.51%
jan 1, 1999
14.2
-0.4
-2.74%
jan 1, 2000
13.8
-0.4
-2.82%
jan 1, 2002
13.4
-0.4
-2.9%
jan 1, 2003
19.5
+6.1
45.52%
jan 1, 2004
20.7
+1.2
6.15%
jan 1, 2005
20.9
+0.2
0.97%
jan 1, 2007
20.8
-0.1
-0.48%
jan 1, 2008
25.0
+4.2
20.19%
jan 1, 2009
28.1
+3.1
12.4%
jan 1, 2010
27.4
-0.7
-2.49%
jan 1, 2011
28.2
+0.8
2.92%
jan 1, 2012
25.3
-2.9
-10.28%
jan 1, 2013
26.1
+0.8
3.16%
jan 1, 2014
50.5
+24.4
93.49%
Ranking of countries by current statistics by years


Comments: