29
/
en
AIzaSyAYiBZKx7MnpbEhh9jyipgxe19OcubqV5w
April 1, 2024
26217
Central Europe and the Baltics
CEB
false
2
1
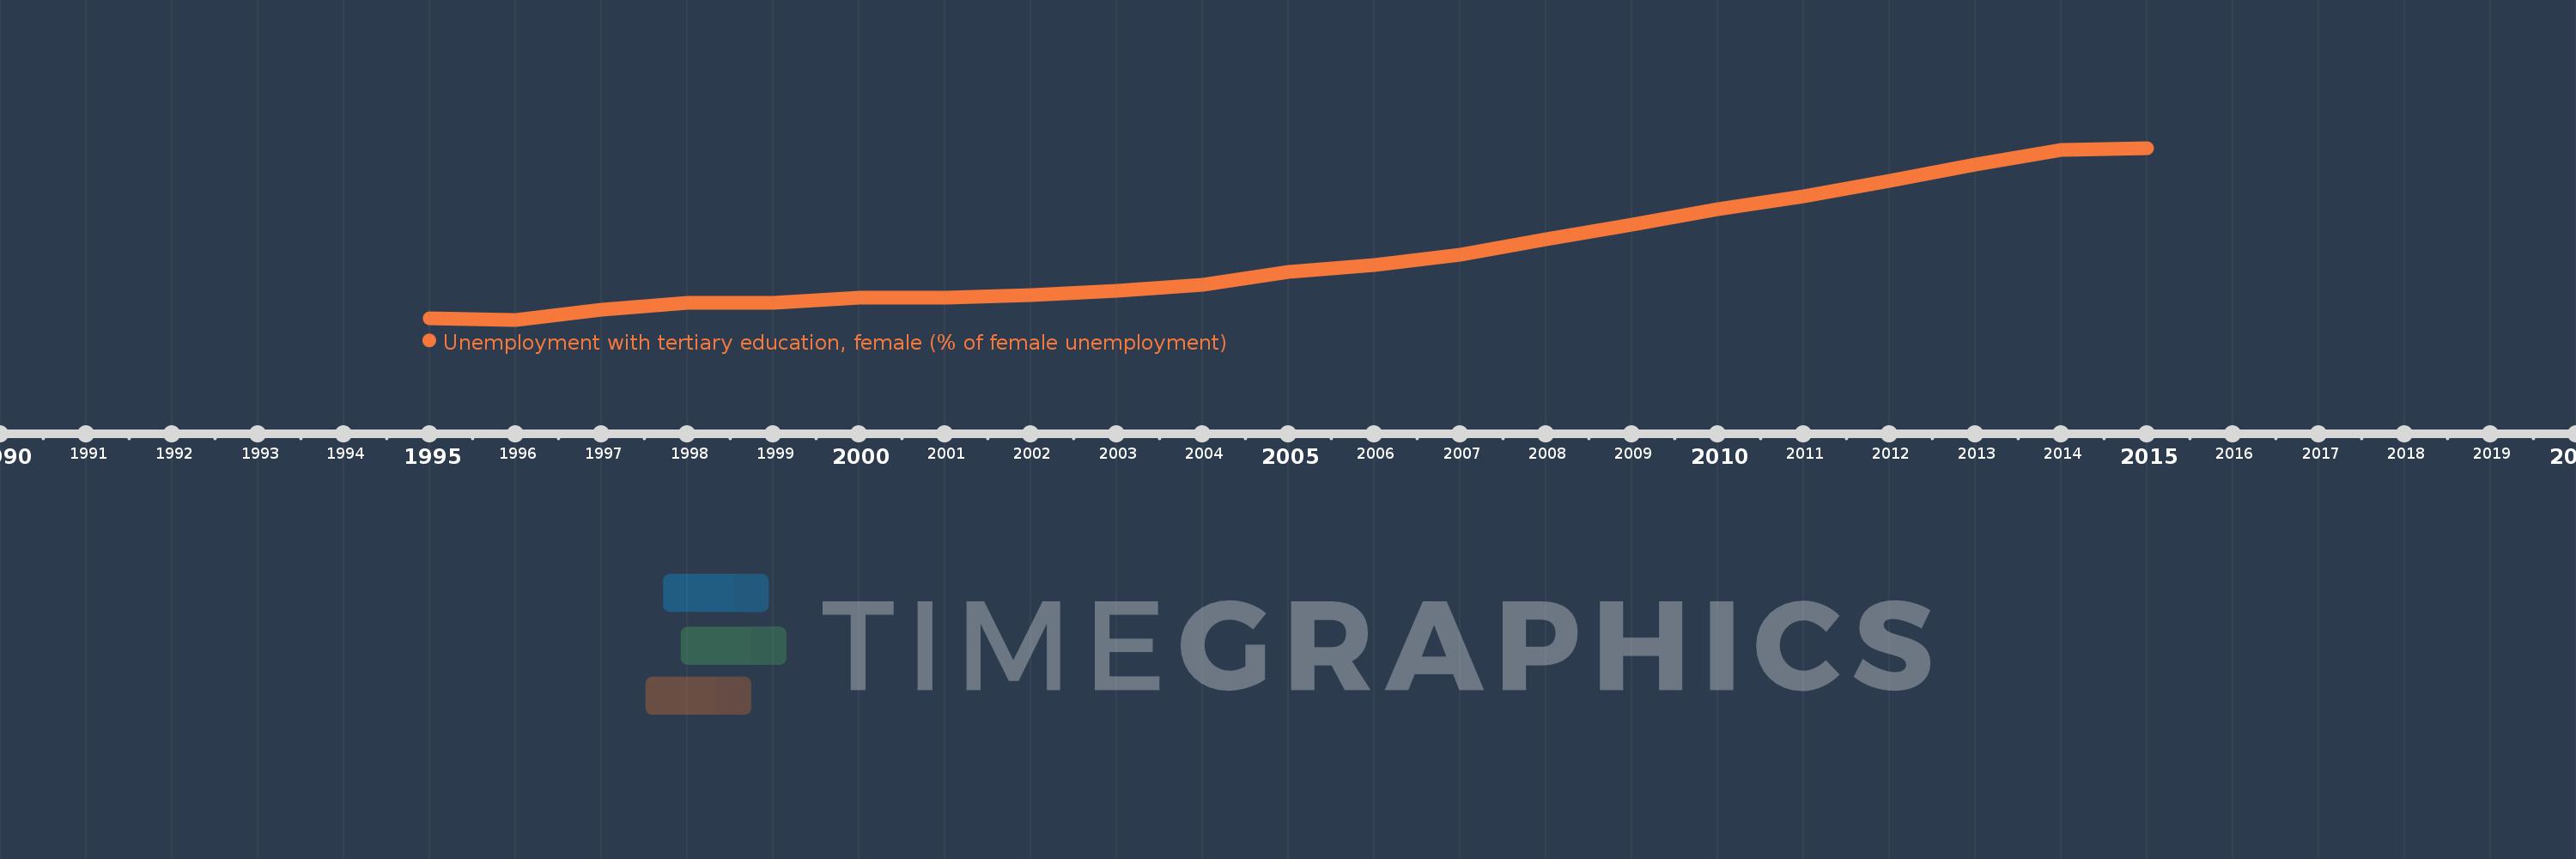
Unemployment with tertiary education, female (% of female unemployment)
2015,2014,2013,2012,2011,2010,2009,2008,2007,2006,2005,2004,2003,2002,2001,2000,1999,1998,1997,1996,1995
This statistics in other country:
Timeline:
This timeline shows a graph from 1995 to 2015 of Central Europe and the Baltics. No data until 1994. Number of actual observations by date: 21.
Source name:
World Development Indicators
Source organization:
International Labour Organization, Key Indicators of the Labour Market database.
Categories, topics:
Social Protection & Labor, Gender
Last updated:
apr 23, 2017
Indicators value changes by year
Maximum:
18.918
jan 1, 2015
At the date of observation
Value
Absolute change
Change from previous value
jan 1, 1995
4.833
+4.833
0.0%
jan 1, 1996
4.688
-0.145
-3.01%
jan 1, 1997
5.508
+0.821
17.51%
jan 1, 1998
6.105
+0.597
10.84%
jan 1, 1999
6.078
-0.027
-0.44%
jan 1, 2000
6.491
+0.413
6.79%
jan 1, 2001
6.513
+0.022
0.33%
jan 1, 2002
6.697
+0.184
2.83%
jan 1, 2003
7.115
+0.417
6.23%
jan 1, 2004
7.609
+0.495
6.96%
jan 1, 2005
8.659
+1.05
13.8%
jan 1, 2006
9.248
+0.588
6.79%
jan 1, 2007
10.062
+0.814
8.81%
jan 1, 2008
11.372
+1.31
13.02%
jan 1, 2009
12.557
+1.185
10.42%
jan 1, 2010
13.862
+1.305
10.4%
jan 1, 2011
14.927
+1.064
7.68%
jan 1, 2012
16.224
+1.297
8.69%
jan 1, 2013
17.569
+1.345
8.29%
jan 1, 2014
18.719
+1.15
6.54%
jan 1, 2015
18.918
+0.2
1.07%
Ranking of countries by current statistics by years


Comments: