30
/
AIzaSyAYiBZKx7MnpbEhh9jyipgxe19OcubqV5w
April 1, 2024
42287
Latin America & Caribbean (excluding high income)
LAC
false
2
1
Employers, male (% of male employment)
2013,2012,2010,2009,2008,2007,2006,2005,2004,2003,2002,2001,1997,1996,1994
Download
Global statistics library →Latin America & Caribbean (excluding high income) →

Employers, male (% of male employment)

This statistics in other country:

AlbaniaAlgeriaAmerican SamoaAntigua and BarbudaArgentinaArmeniaArubaAustriaAzerbaijanBahrainBangladeshBarbadosBelarusBelgiumBelizeBeninBermudaBhutanBoliviaBotswanaBrazilBritish Virgin IslandsBrunei DarussalamBulgariaBurkina FasoBurundiCabo VerdeCambodiaCameroonCaribbean small statesCayman IslandsCentral Europe and the BalticsChadChileColombiaCongo, Rep.Costa RicaCote d'IvoireCroatiaCyprusCzech RepublicDenmarkDjiboutiDominicaDominican RepublicEarly-demographic dividendEcuadorEgypt, Arab Rep.El SalvadorEstoniaEthiopiaEuro areaEurope & Central AsiaEurope & Central Asia (excluding high income)Europe & Central Asia (IDA & IBRD countries)European UnionFijiFinlandFranceGabonGambia, TheGeorgiaGermanyGhanaGreeceGrenadaGuatemalaGuineaHondurasHong Kong SAR, ChinaHungaryIcelandIndiaIndonesiaIran, Islamic Rep.IrelandIsle of ManItalyJamaicaJordanKazakhstanKiribatiKosovoKuwaitKyrgyz RepublicLao PDRLatin America & Caribbean Latin America & Caribbean (excluding high income)Latin America & the Caribbean (IDA & IBRD countries)LatviaLebanonLesothoLiberiaLithuaniaLower middle incomeLuxembourgMacao SAR, ChinaMacedonia, FYRMadagascarMalawiMalaysiaMaldivesMaliMaltaMarshall IslandsMauritiusMiddle East & North Africa (excluding high income)Middle East & North Africa (IDA & IBRD countries)MoldovaMongoliaMoroccoMozambiqueNamibiaNepalNetherlandsNicaraguaNigerNorwayOmanPakistanPanamaParaguayPeruPhilippinesPolandPortugalQatarRomaniaRussian FederationRwandaSamoaSan MarinoSao Tome and PrincipeSaudi ArabiaSenegalSerbiaSeychellesSingaporeSlovak RepublicSloveniaSouth AfricaSouth AsiaSouth Asia (IDA & IBRD)SpainSri LankaSt. Kitts and NevisSt. LuciaSt. Vincent and the GrenadinesSurinameSwazilandSwedenSwitzerlandSyrian Arab RepublicTajikistanTanzaniaThailandTimor-LesteTongaTrinidad and TobagoTunisiaTurkeyTurks and Caicos IslandsTuvaluUgandaUkraineUnited Arab EmiratesUnited KingdomUruguayVanuatuVenezuela, RBVietnamWest Bank and GazaYemen, Rep.ZambiaZimbabwe

Timeline:

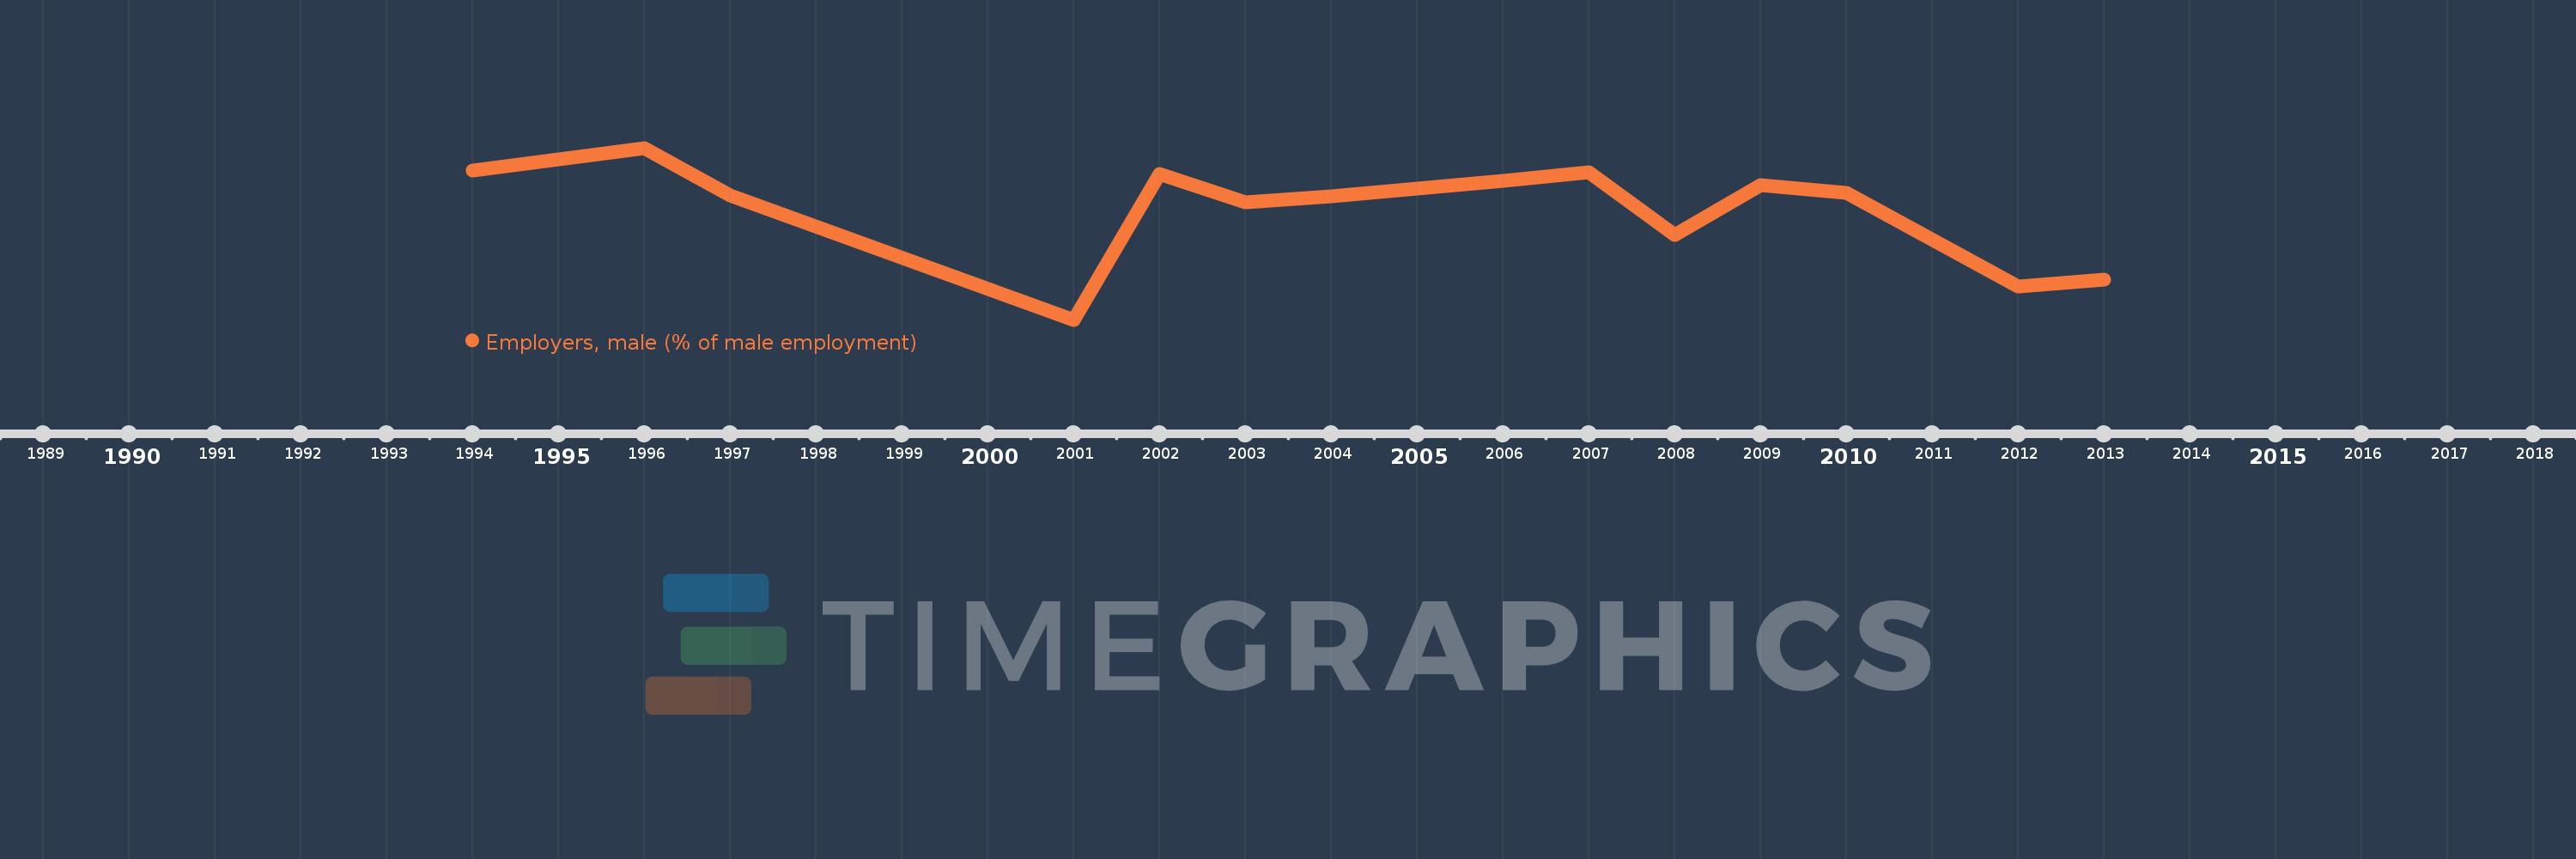
This timeline shows a graph from 1994 to 2013 of Latin America & Caribbean (excluding high income). No data until 1993. Number of actual observations by date: 15.

Source name:

World Development Indicators

Source organization:

ILO Key Indicators of the Labour Market (KILM).

Categories, topics:

Social Protection & Labor, Gender

Last updated:

apr 23, 2017

Indicators value changes by year

Meaning:
5.614
Minimum:
4.602
jan 1, 2001
Maximum:
6.166
jan 1, 1996
At the date of observation
Value
Absolute change
Change from the previous value
jan 1, 1994
5.958
+5.958
0.0%
jan 1, 1996
6.166
+0.208
3.49%
jan 1, 1997
5.732
-0.433
-7.03%
jan 1, 2001
4.602
-1.13
-19.71%
jan 1, 2002
5.926
+1.323
28.76%
jan 1, 2003
5.672
-0.254
-4.29%
jan 1, 2004
5.728
+0.056
1.0%
jan 1, 2005
5.799
+0.07
1.23%
jan 1, 2006
5.863
+0.065
1.12%
jan 1, 2007
5.943
+0.079
1.36%
jan 1, 2008
5.375
-0.568
-9.56%
jan 1, 2009
5.824
+0.449
8.36%
jan 1, 2010
5.756
-0.068
-1.17%
jan 1, 2012
4.906
-0.85
-14.77%
jan 1, 2013
4.965
+0.059
1.19%

Ranking of countries by current statistics by years