29
/
en
AIzaSyAYiBZKx7MnpbEhh9jyipgxe19OcubqV5w
April 1, 2024
25612
Central Europe and the Baltics
CEB
false
2
1
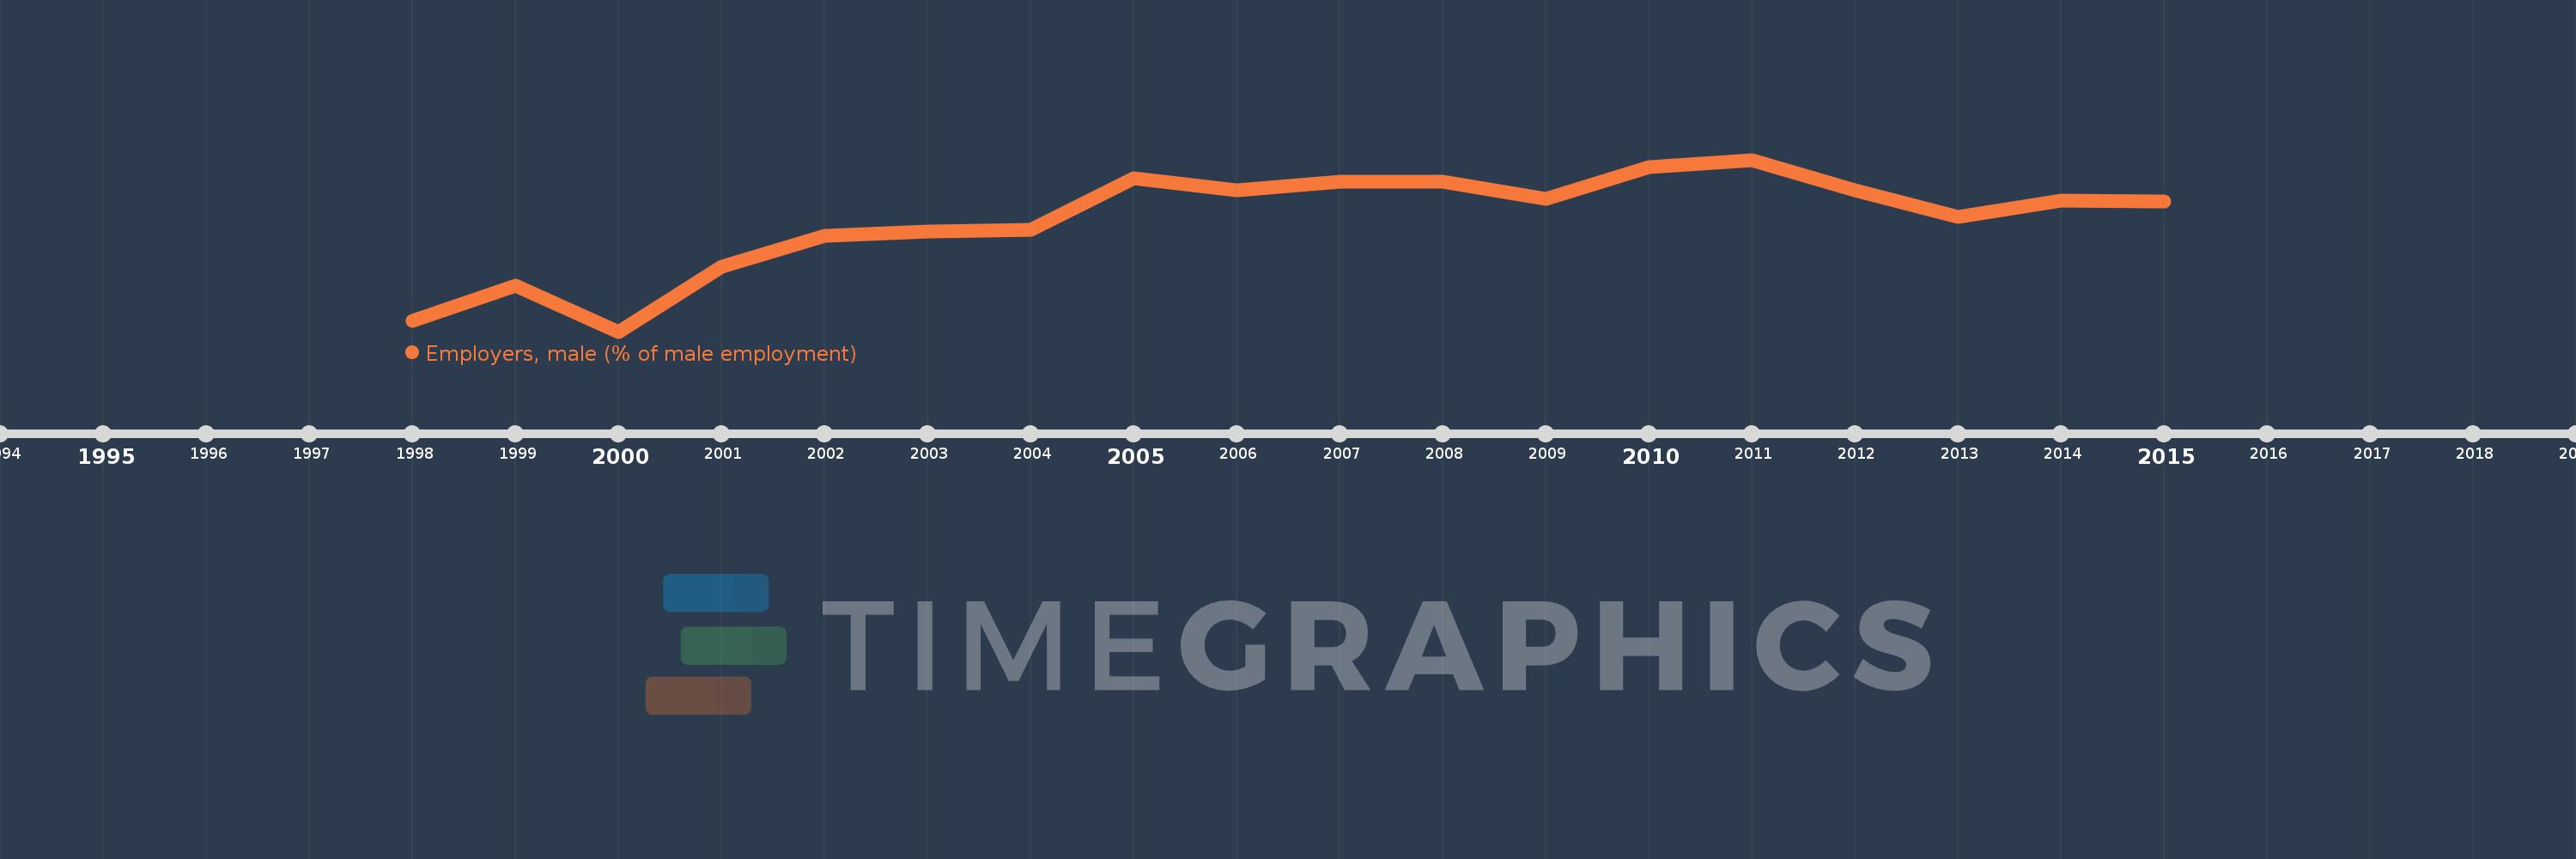
Employers, male (% of male employment)
2015,2014,2013,2012,2011,2010,2009,2008,2007,2006,2005,2004,2003,2002,2001,2000,1999,1998
This statistics in other country:
Timeline:
This timeline shows a graph from 1998 to 2015 of Central Europe and the Baltics. No data until 1997. Number of actual observations by date: 18.
Source name:
World Development Indicators
Source organization:
ILO Key Indicators of the Labour Market (KILM).
Categories, topics:
Social Protection & Labor, Gender
Last updated:
apr 23, 2017
Indicators value changes by year
At the date of observation
Value
Absolute change
Change from previous value
jan 1, 1998
3.916
+3.916
0.0%
jan 1, 1999
4.098
+0.182
4.64%
jan 1, 2000
3.861
-0.237
-5.78%
jan 1, 2001
4.196
+0.335
8.68%
jan 1, 2002
4.36
+0.163
3.89%
jan 1, 2003
4.379
+0.019
0.45%
jan 1, 2004
4.388
+0.009
0.21%
jan 1, 2005
4.659
+0.271
6.17%
jan 1, 2006
4.594
-0.065
-1.39%
jan 1, 2007
4.642
+0.047
1.03%
jan 1, 2008
4.64
-0.002
-0.04%
jan 1, 2009
4.552
-0.088
-1.89%
jan 1, 2010
4.718
+0.166
3.64%
jan 1, 2011
4.754
+0.037
0.78%
jan 1, 2012
4.597
-0.157
-3.3%
jan 1, 2013
4.459
-0.138
-3.0%
jan 1, 2014
4.54
+0.08
1.8%
jan 1, 2015
4.539
-0.001
-0.03%
Ranking of countries by current statistics by years


Comments: