29
/
en
AIzaSyAYiBZKx7MnpbEhh9jyipgxe19OcubqV5w
April 1, 2024
112132
Costa Rica
CRI
true
2
1
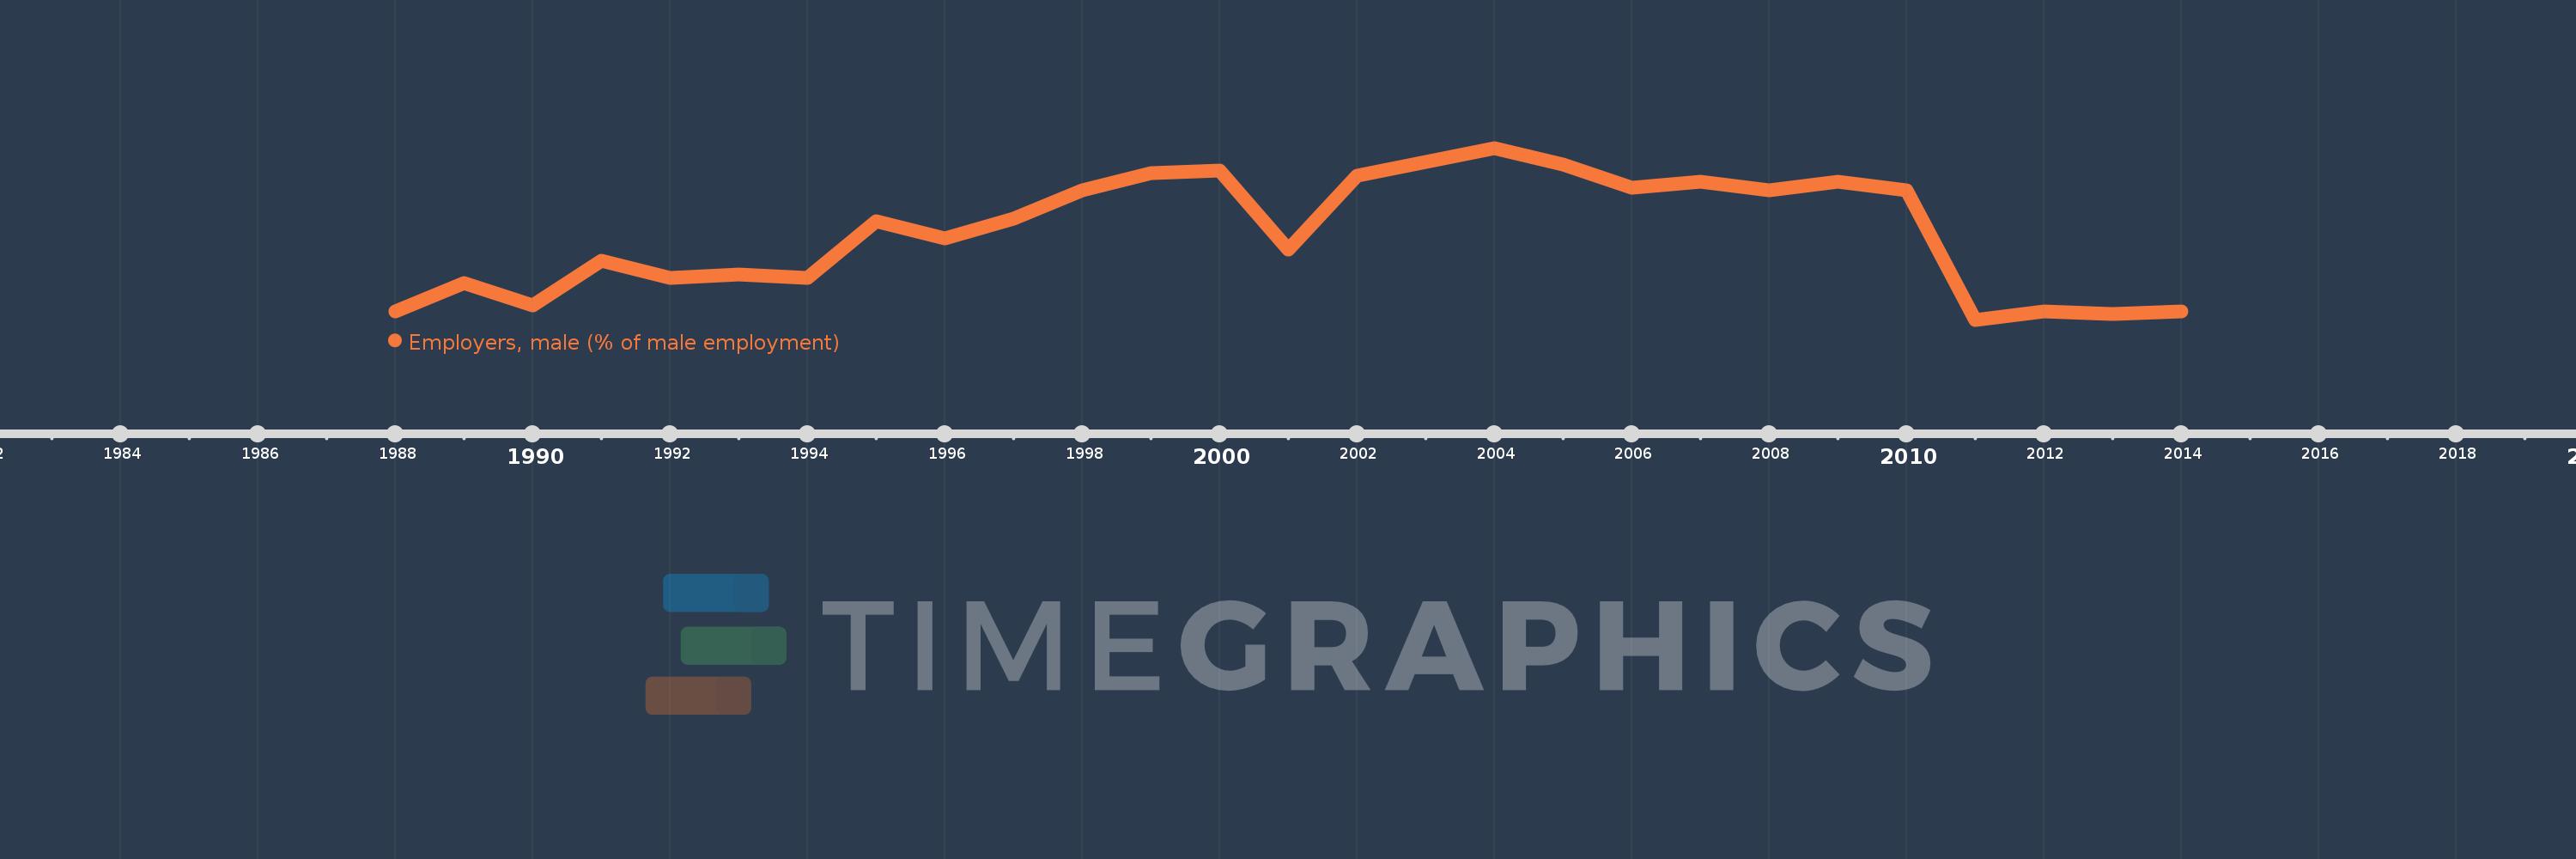
Employers, male (% of male employment)
2014,2013,2012,2011,2010,2009,2008,2007,2006,2005,2004,2002,2001,2000,1999,1998,1997,1996,1995,1994,1993,1992,1991,1990,1989,1988
This statistics in other country:
Timeline:
This timeline shows a graph from 1988 to 2014 of Costa Rica. No data until 1987. Number of actual observations by date: 26.
Source name:
World Development Indicators
Source organization:
ILO Key Indicators of the Labour Market (KILM).
Categories, topics:
Social Protection & Labor, Gender
Last updated:
apr 23, 2017
Indicators value changes by year
At the date of observation
Value
Absolute change
Change from previous value
jan 1, 1989
5.8
+1.0
20.83%
jan 1, 1990
5.0
-0.8
-13.79%
jan 1, 1991
6.6
+1.6
32.0%
jan 1, 1992
6.0
-0.6
-9.09%
jan 1, 1993
6.1
+0.1
1.67%
jan 1, 1994
6.0
-0.1
-1.64%
jan 1, 1995
8.0
+2.0
33.33%
jan 1, 1996
7.4
-0.6
-7.5%
jan 1, 1997
8.1
+0.7
9.46%
jan 1, 1998
9.1
+1.0
12.35%
jan 1, 1999
9.7
+0.6
6.59%
jan 1, 2000
9.8
+0.1
1.03%
jan 1, 2001
7.0
-2.8
-28.57%
jan 1, 2002
9.6
+2.6
37.14%
jan 1, 2004
10.6
+1.0
10.42%
jan 1, 2005
10.0
-0.6
-5.66%
jan 1, 2006
9.2
-0.8
-8.0%
jan 1, 2007
9.4
+0.2
2.17%
jan 1, 2008
9.1
-0.3
-3.19%
jan 1, 2010
9.1
-0.3
-3.19%
jan 1, 2011
4.5
-4.6
-50.55%
jan 1, 2012
4.8
+0.3
6.67%
jan 1, 2013
4.7
-0.1
-2.08%
jan 1, 2014
4.8
+0.1
2.13%
Ranking of countries by current statistics by years


Comments: