29
/
en
AIzaSyAYiBZKx7MnpbEhh9jyipgxe19OcubqV5w
April 1, 2024
266736
Trinidad and Tobago
TTO
true
2
1
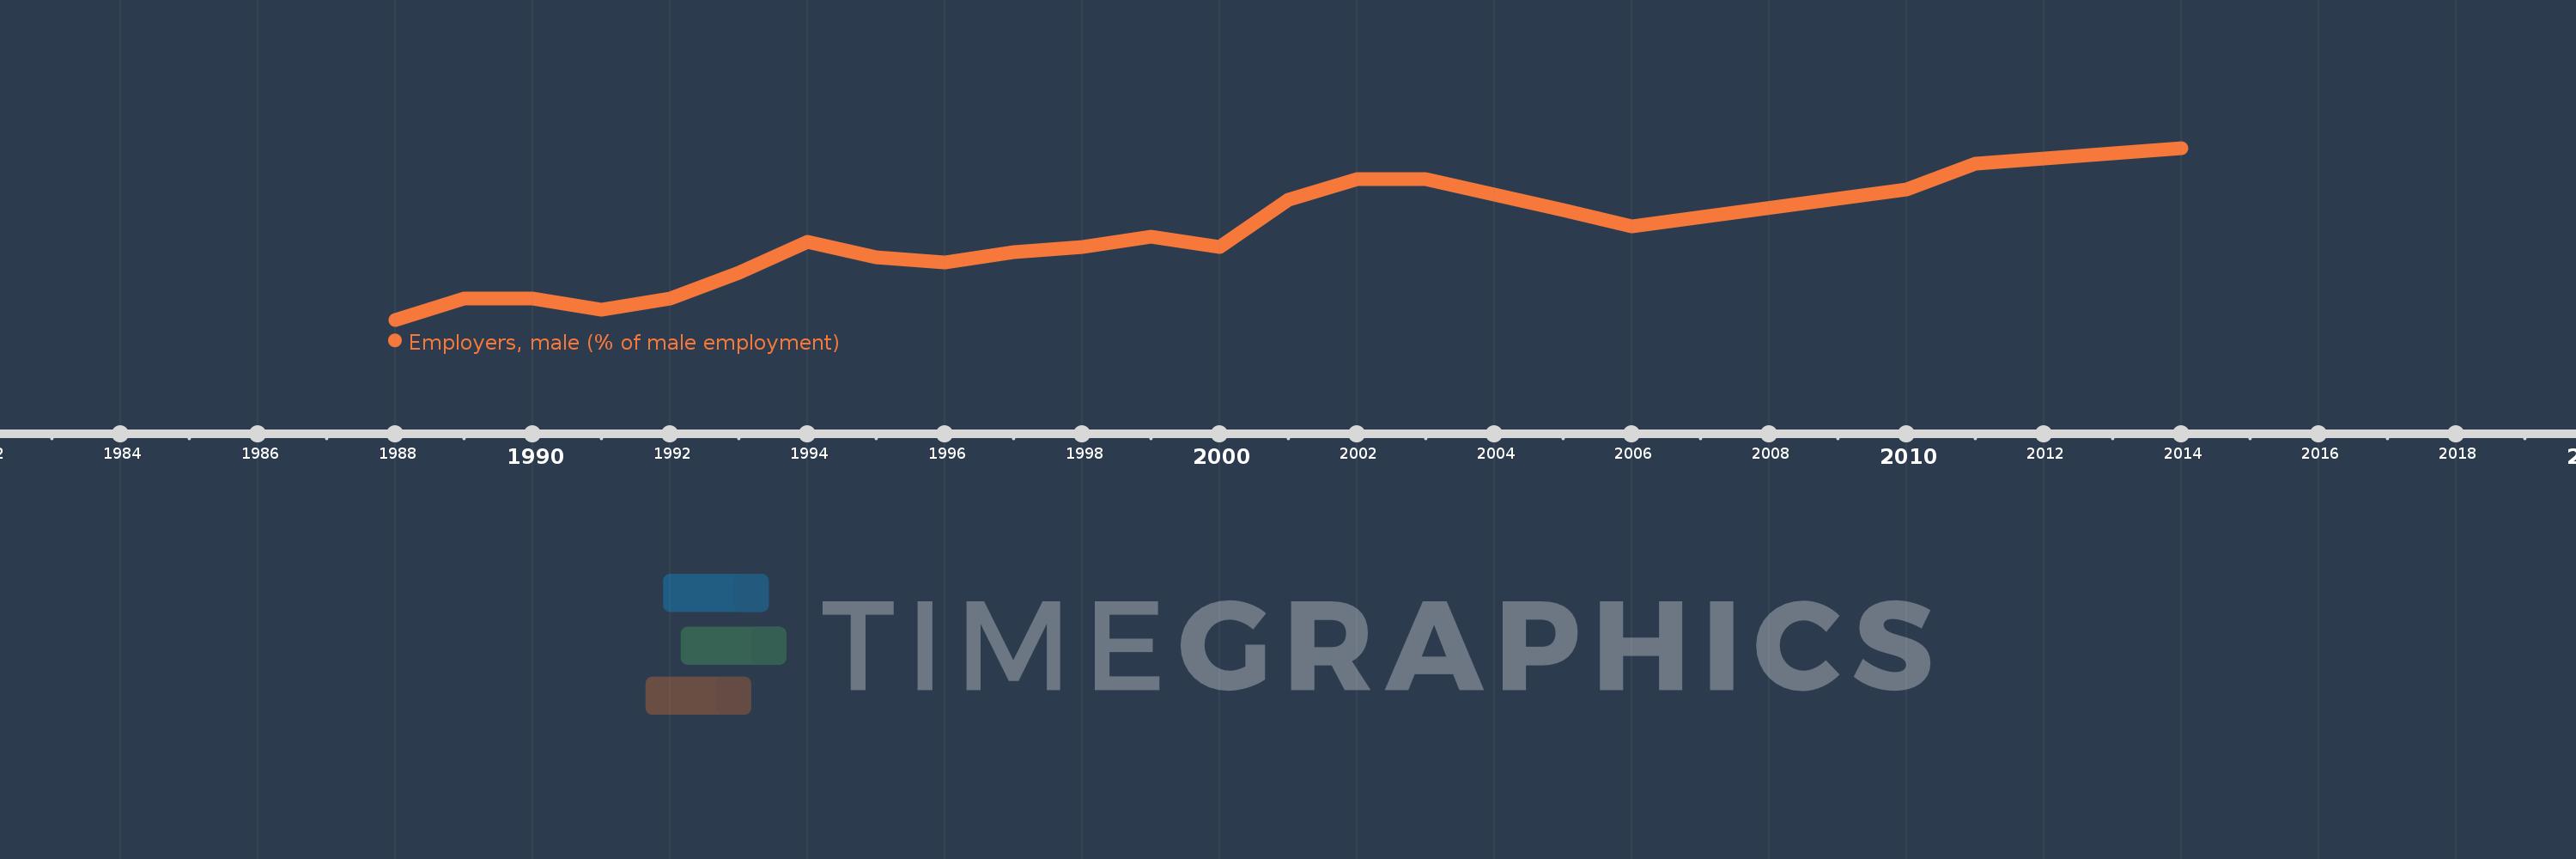
Employers, male (% of male employment)
2014,2011,2010,2006,2005,2004,2003,2002,2001,2000,1999,1998,1997,1996,1995,1994,1993,1992,1991,1990,1989,1988
This statistics in other country:
Timeline:
This timeline shows a graph from 1988 to 2014 of Trinidad and Tobago. No data until 1987. Number of actual observations by date: 22.
Source name:
World Development Indicators
Source organization:
ILO Key Indicators of the Labour Market (KILM).
Categories, topics:
Social Protection & Labor, Gender
Last updated:
apr 23, 2017
Indicators value changes by year
At the date of observation
Value
Absolute change
Change from previous value
jan 1, 1989
4.1
+0.4
10.81%
jan 1, 1991
3.9
-0.2
-4.88%
jan 1, 1992
4.1
+0.2
5.13%
jan 1, 1993
4.6
+0.5
12.2%
jan 1, 1994
5.2
+0.6
13.04%
jan 1, 1995
4.9
-0.3
-5.77%
jan 1, 1996
4.8
-0.1
-2.04%
jan 1, 1997
5.0
+0.2
4.17%
jan 1, 1999
5.3
+0.2
3.92%
jan 1, 2000
5.1
-0.2
-3.77%
jan 1, 2001
6.0
+0.9
17.65%
jan 1, 2002
6.4
+0.4
6.67%
jan 1, 2004
6.1
-0.3
-4.69%
jan 1, 2005
5.8
-0.3
-4.92%
jan 1, 2006
5.5
-0.3
-5.17%
jan 1, 2010
6.2
+0.7
12.73%
jan 1, 2011
6.7
+0.5
8.06%
jan 1, 2014
7.0
+0.3
4.48%
Ranking of countries by current statistics by years


Comments: