29
/
en
AIzaSyAYiBZKx7MnpbEhh9jyipgxe19OcubqV5w
April 1, 2024
141707
Greece
GRC
true
2
1
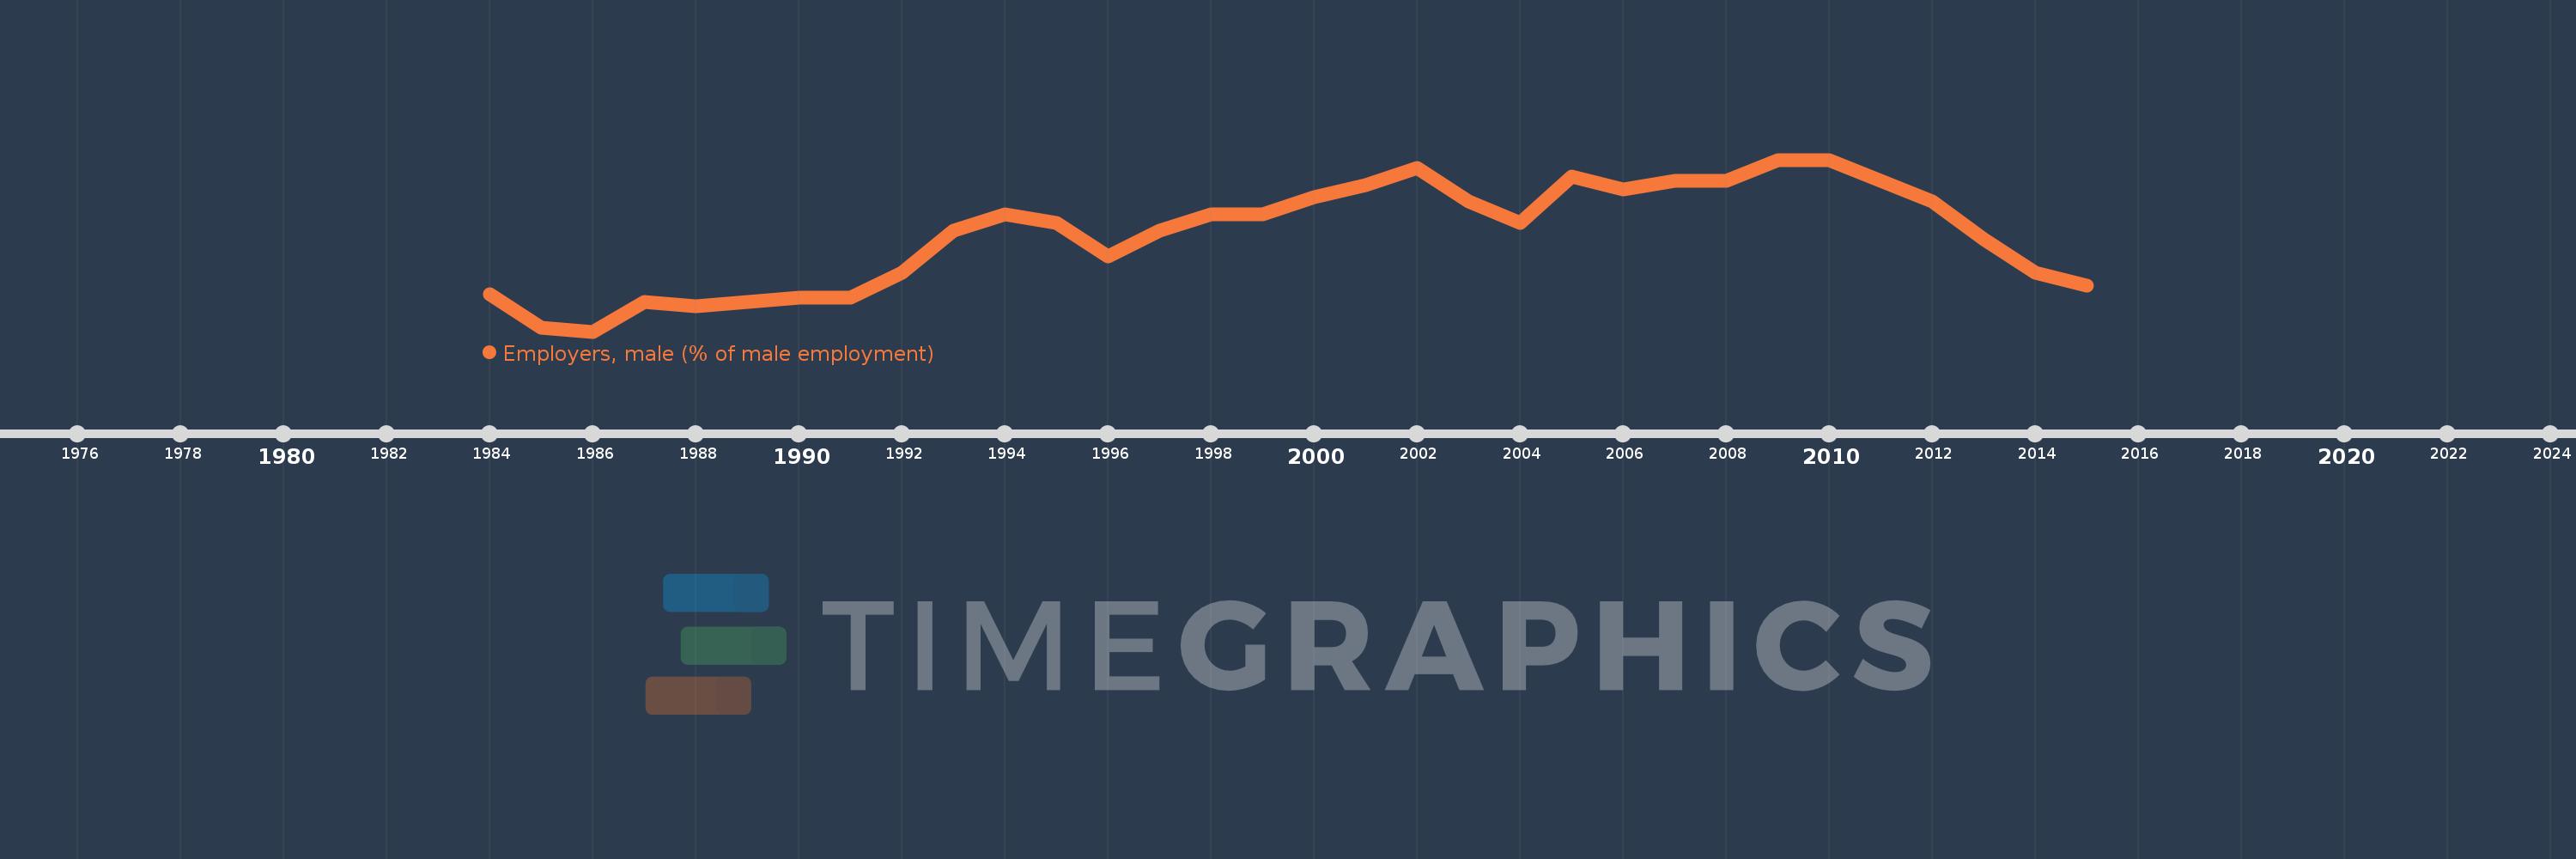
Employers, male (% of male employment)
2015,2014,2013,2012,2011,2010,2009,2008,2007,2006,2005,2004,2003,2002,2001,2000,1999,1998,1997,1996,1995,1994,1993,1992,1991,1990,1989,1988,1987,1986,1985,1984
This statistics in other country:
Timeline:
This timeline shows a graph from 1984 to 2015 of Greece. No data until 1983. Number of actual observations by date: 32.
Source name:
World Development Indicators
Source organization:
ILO Key Indicators of the Labour Market (KILM).
Categories, topics:
Social Protection & Labor, Gender
Last updated:
apr 23, 2017
Indicators value changes by year
At the date of observation
Value
Absolute change
Change from previous value
jan 1, 1985
7.0
-0.8
-10.26%
jan 1, 1986
6.9
-0.1
-1.43%
jan 1, 1987
7.6
+0.7
10.14%
jan 1, 1988
7.5
-0.1
-1.32%
jan 1, 1989
7.6
+0.1
1.33%
jan 1, 1990
7.7
+0.1
1.32%
jan 1, 1992
8.3
+0.6
7.79%
jan 1, 1993
9.3
+1.0
12.05%
jan 1, 1995
9.5
-0.2
-2.06%
jan 1, 1996
8.7
-0.8
-8.42%
jan 1, 2000
10.1
+0.4
4.12%
jan 1, 2001
10.4
+0.3
2.97%
jan 1, 2002
10.8
+0.4
3.85%
jan 1, 2003
10.0
-0.8
-7.41%
jan 1, 2004
9.5
-0.5
-5.0%
jan 1, 2005
10.6
+1.1
11.58%
jan 1, 2006
10.3
-0.3
-2.83%
jan 1, 2007
10.5
+0.2
1.94%
jan 1, 2009
11.0
+0.5
4.76%
jan 1, 2011
10.5
-0.5
-4.55%
jan 1, 2012
10.0
-0.5
-4.76%
jan 1, 2013
9.1
-0.9
-9.0%
jan 1, 2014
8.3
-0.8
-8.79%
jan 1, 2015
8.0
-0.3
-3.61%
Ranking of countries by current statistics by years


Comments: