29
/
en
AIzaSyAYiBZKx7MnpbEhh9jyipgxe19OcubqV5w
April 1, 2024
29775
Euro area
EMU
false
2
1
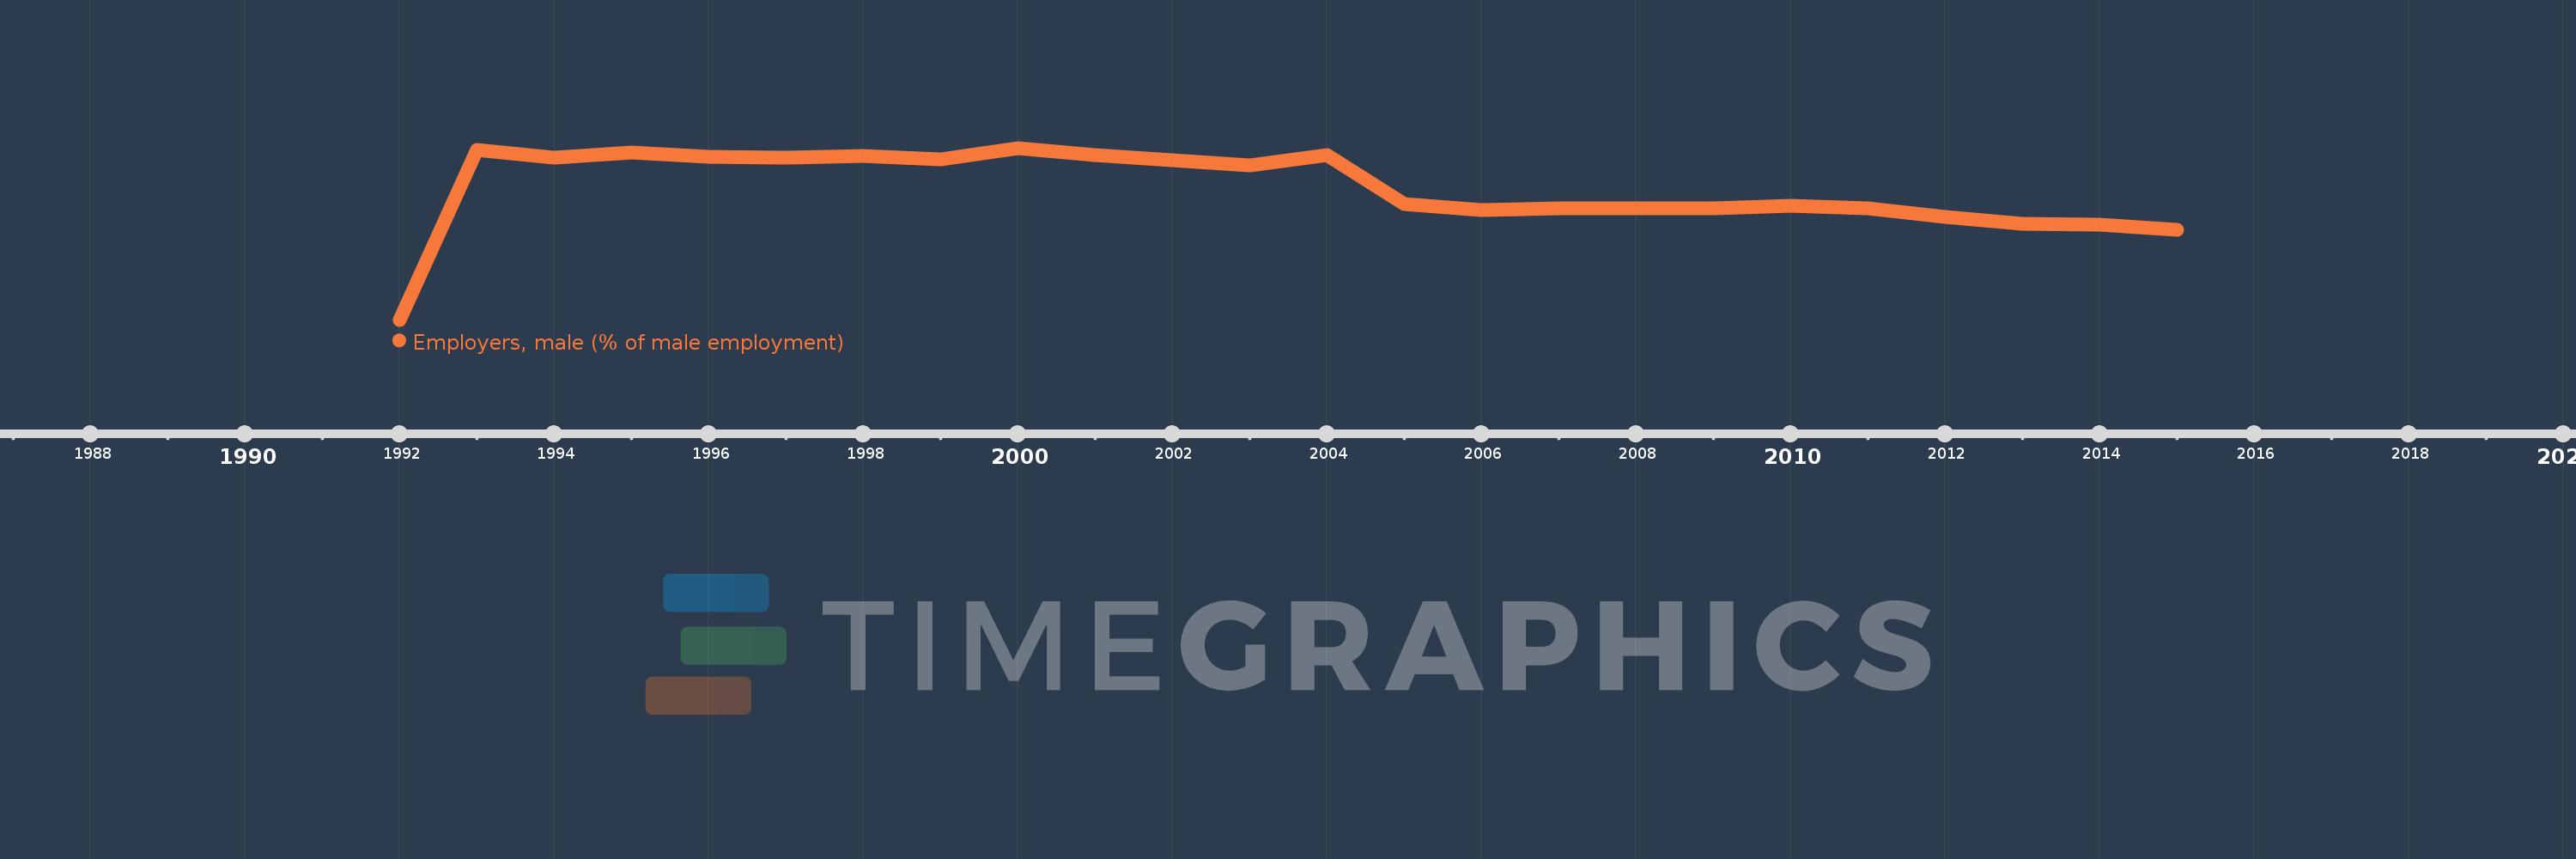
Employers, male (% of male employment)
2015,2014,2013,2012,2011,2010,2009,2008,2007,2006,2005,2004,2003,2002,2001,2000,1999,1998,1997,1996,1995,1994,1993,1992
This statistics in other country:
Timeline:
This timeline shows a graph from 1992 to 2015 of Euro area. No data until 1991. Number of actual observations by date: 24.
Source name:
World Development Indicators
Source organization:
ILO Key Indicators of the Labour Market (KILM).
Categories, topics:
Social Protection & Labor, Gender
Last updated:
apr 23, 2017
Indicators value changes by year
At the date of observation
Value
Absolute change
Change from previous value
jan 1, 1992
4.996
+4.996
0.0%
jan 1, 1993
8.189
+3.193
63.92%
jan 1, 1994
8.04
-0.149
-1.82%
jan 1, 1995
8.149
+0.109
1.35%
jan 1, 1996
8.055
-0.094
-1.16%
jan 1, 1997
8.05
-0.005
-0.06%
jan 1, 1998
8.073
+0.023
0.29%
jan 1, 1999
8.018
-0.055
-0.68%
jan 1, 2000
8.228
+0.21
2.61%
jan 1, 2001
8.095
-0.132
-1.61%
jan 1, 2002
7.998
-0.098
-1.21%
jan 1, 2003
7.893
-0.105
-1.32%
jan 1, 2004
8.088
+0.195
2.47%
jan 1, 2005
7.172
-0.916
-11.32%
jan 1, 2006
7.054
-0.118
-1.64%
jan 1, 2007
7.096
+0.042
0.6%
jan 1, 2008
7.085
-0.011
-0.15%
jan 1, 2009
7.098
+0.012
0.17%
jan 1, 2010
7.139
+0.042
0.59%
jan 1, 2011
7.1
-0.04
-0.55%
jan 1, 2012
6.936
-0.164
-2.31%
jan 1, 2013
6.795
-0.141
-2.03%
jan 1, 2014
6.786
-0.009
-0.13%
jan 1, 2015
6.694
-0.092
-1.36%
Ranking of countries by current statistics by years


Comments: