29
/
en
AIzaSyAYiBZKx7MnpbEhh9jyipgxe19OcubqV5w
April 1, 2024
31495
Europe & Central Asia (excluding high income)
ECA
false
2
1
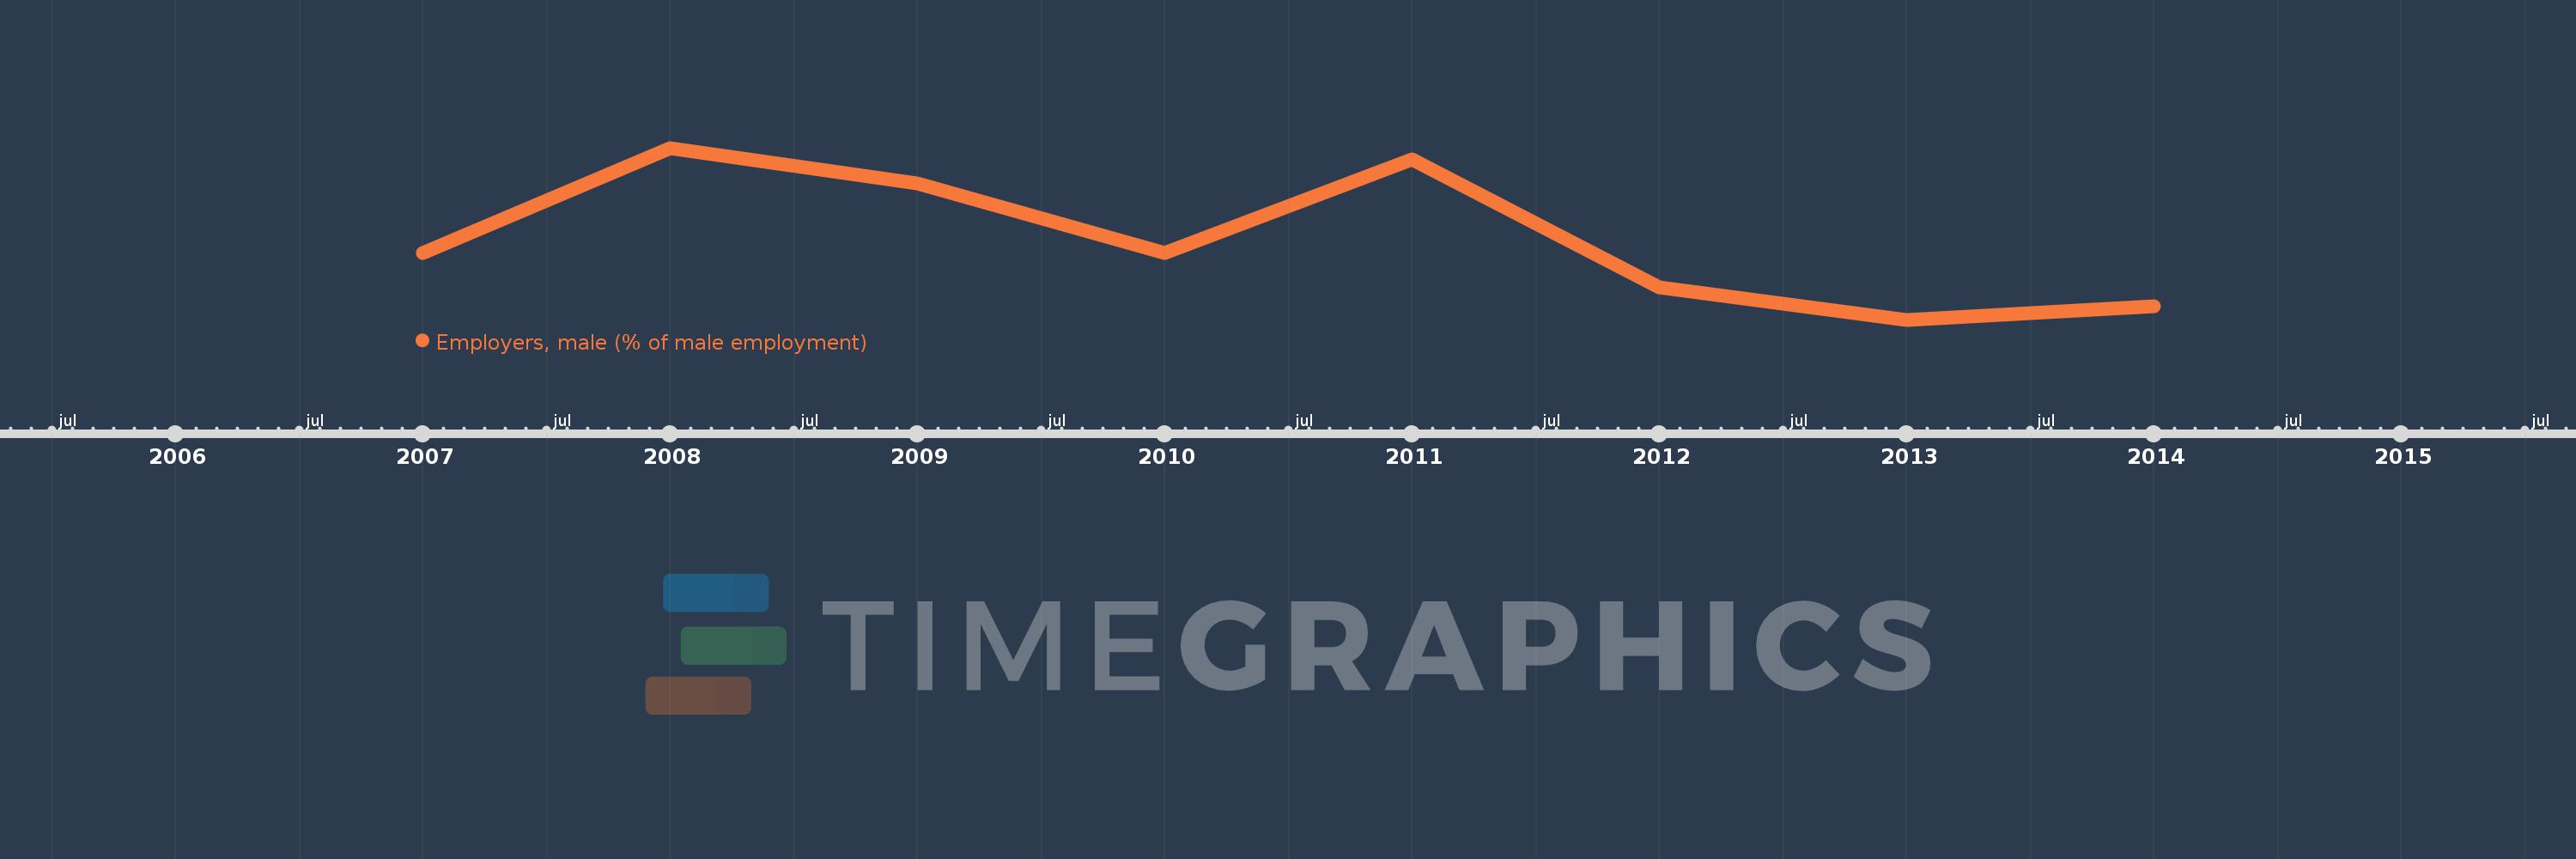
Employers, male (% of male employment)
2014,2013,2012,2011,2010,2009,2008,2007
This statistics in other country:
Timeline:
This timeline shows a graph from 2007 to 2014 of Europe & Central Asia (excluding high income). No data until 2006. Number of actual observations by date: 8.
Source name:
World Development Indicators
Source organization:
ILO Key Indicators of the Labour Market (KILM).
Categories, topics:
Social Protection & Labor, Gender
Last updated:
apr 23, 2017
Indicators value changes by year
At the date of observation
Value
Absolute change
Change from previous value
jan 1, 2007
3.152
+3.152
0.0%
jan 1, 2008
3.442
+0.29
9.2%
jan 1, 2009
3.344
-0.098
-2.86%
jan 1, 2010
3.152
-0.192
-5.74%
jan 1, 2011
3.41
+0.258
8.19%
jan 1, 2012
3.056
-0.354
-10.38%
jan 1, 2013
2.966
-0.09
-2.94%
jan 1, 2014
3.004
+0.038
1.27%
Ranking of countries by current statistics by years


Comments: