29
/
en
AIzaSyAYiBZKx7MnpbEhh9jyipgxe19OcubqV5w
April 1, 2024
33576
European Union
EUU
false
2
1
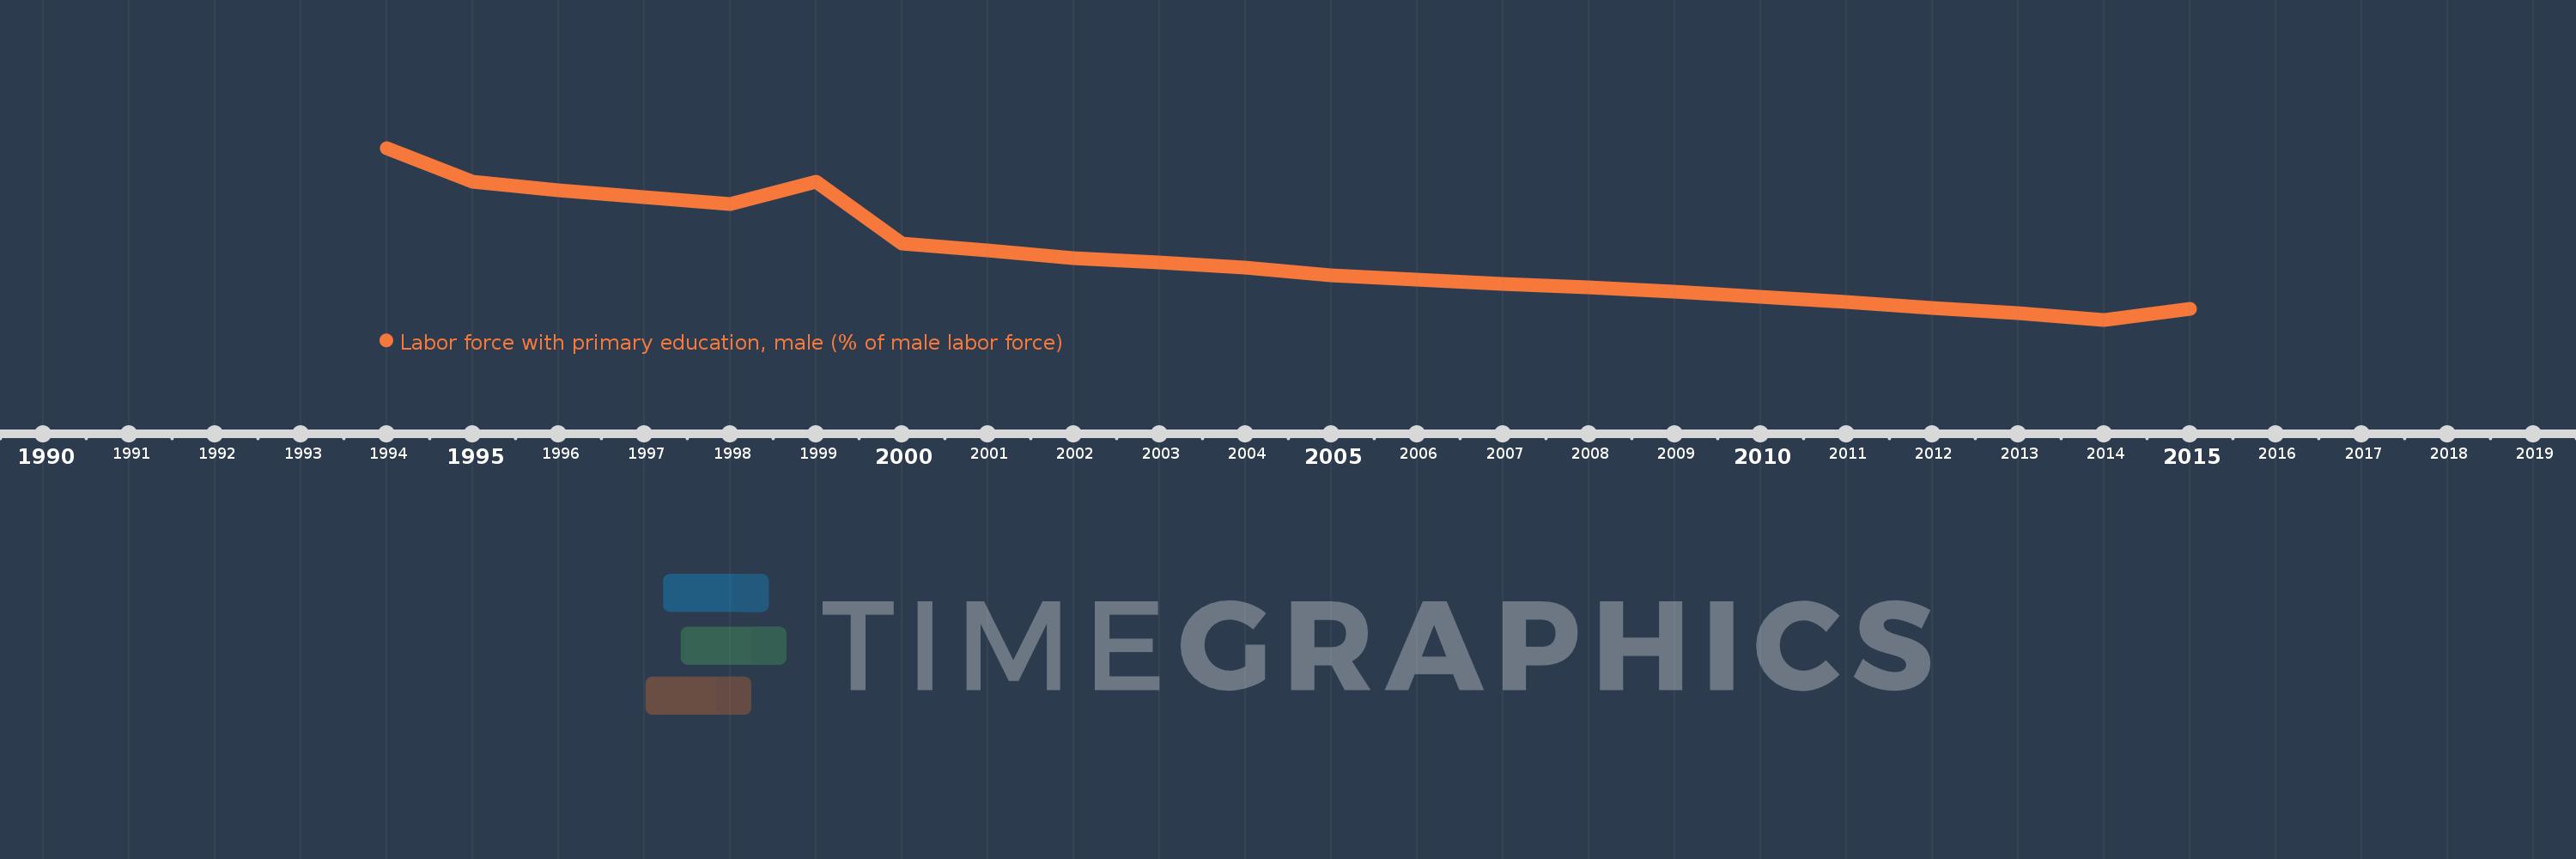
Labor force with primary education, male (% of male labor force)
2015,2014,2013,2012,2011,2010,2009,2008,2007,2006,2005,2004,2003,2002,2001,2000,1999,1998,1997,1996,1995,1994
This statistics in other country:
Timeline:
This timeline shows a graph from 1994 to 2015 of European Union. No data until 1993. Number of actual observations by date: 22.
Source name:
World Development Indicators
Source organization:
International Labour Organization, Key Indicators of the Labour Market database.
Categories, topics:
Education, Social Protection & Labor, Gender
Last updated:
apr 23, 2017
Indicators value changes by year
Minimum:
20.675
jan 1, 2014
Maximum:
41.756
jan 1, 1994
At the date of observation
Value
Absolute change
Change from previous value
jan 1, 1994
41.756
+41.756
0.0%
jan 1, 1995
37.65
-4.106
-9.83%
jan 1, 1996
36.515
-1.135
-3.01%
jan 1, 1997
35.693
-0.823
-2.25%
jan 1, 1998
34.923
-0.77
-2.16%
jan 1, 1999
37.638
+2.715
7.77%
jan 1, 2000
30.02
-7.617
-20.24%
jan 1, 2001
29.182
-0.838
-2.79%
jan 1, 2002
28.209
-0.974
-3.34%
jan 1, 2003
27.699
-0.51
-1.81%
jan 1, 2004
27.059
-0.64
-2.31%
jan 1, 2005
26.159
-0.9
-3.33%
jan 1, 2006
25.621
-0.538
-2.06%
jan 1, 2007
25.116
-0.505
-1.97%
jan 1, 2008
24.603
-0.513
-2.04%
jan 1, 2009
24.124
-0.479
-1.95%
jan 1, 2010
23.532
-0.592
-2.45%
jan 1, 2011
22.847
-0.684
-2.91%
jan 1, 2012
22.106
-0.741
-3.24%
jan 1, 2013
21.525
-0.582
-2.63%
jan 1, 2014
20.675
-0.85
-3.95%
jan 1, 2015
22.02
+1.345
6.5%
Ranking of countries by current statistics by years


Comments: