29
/
en
AIzaSyAYiBZKx7MnpbEhh9jyipgxe19OcubqV5w
April 1, 2024
31756
Europe & Central Asia (excluding high income)
ECA
false
2
1
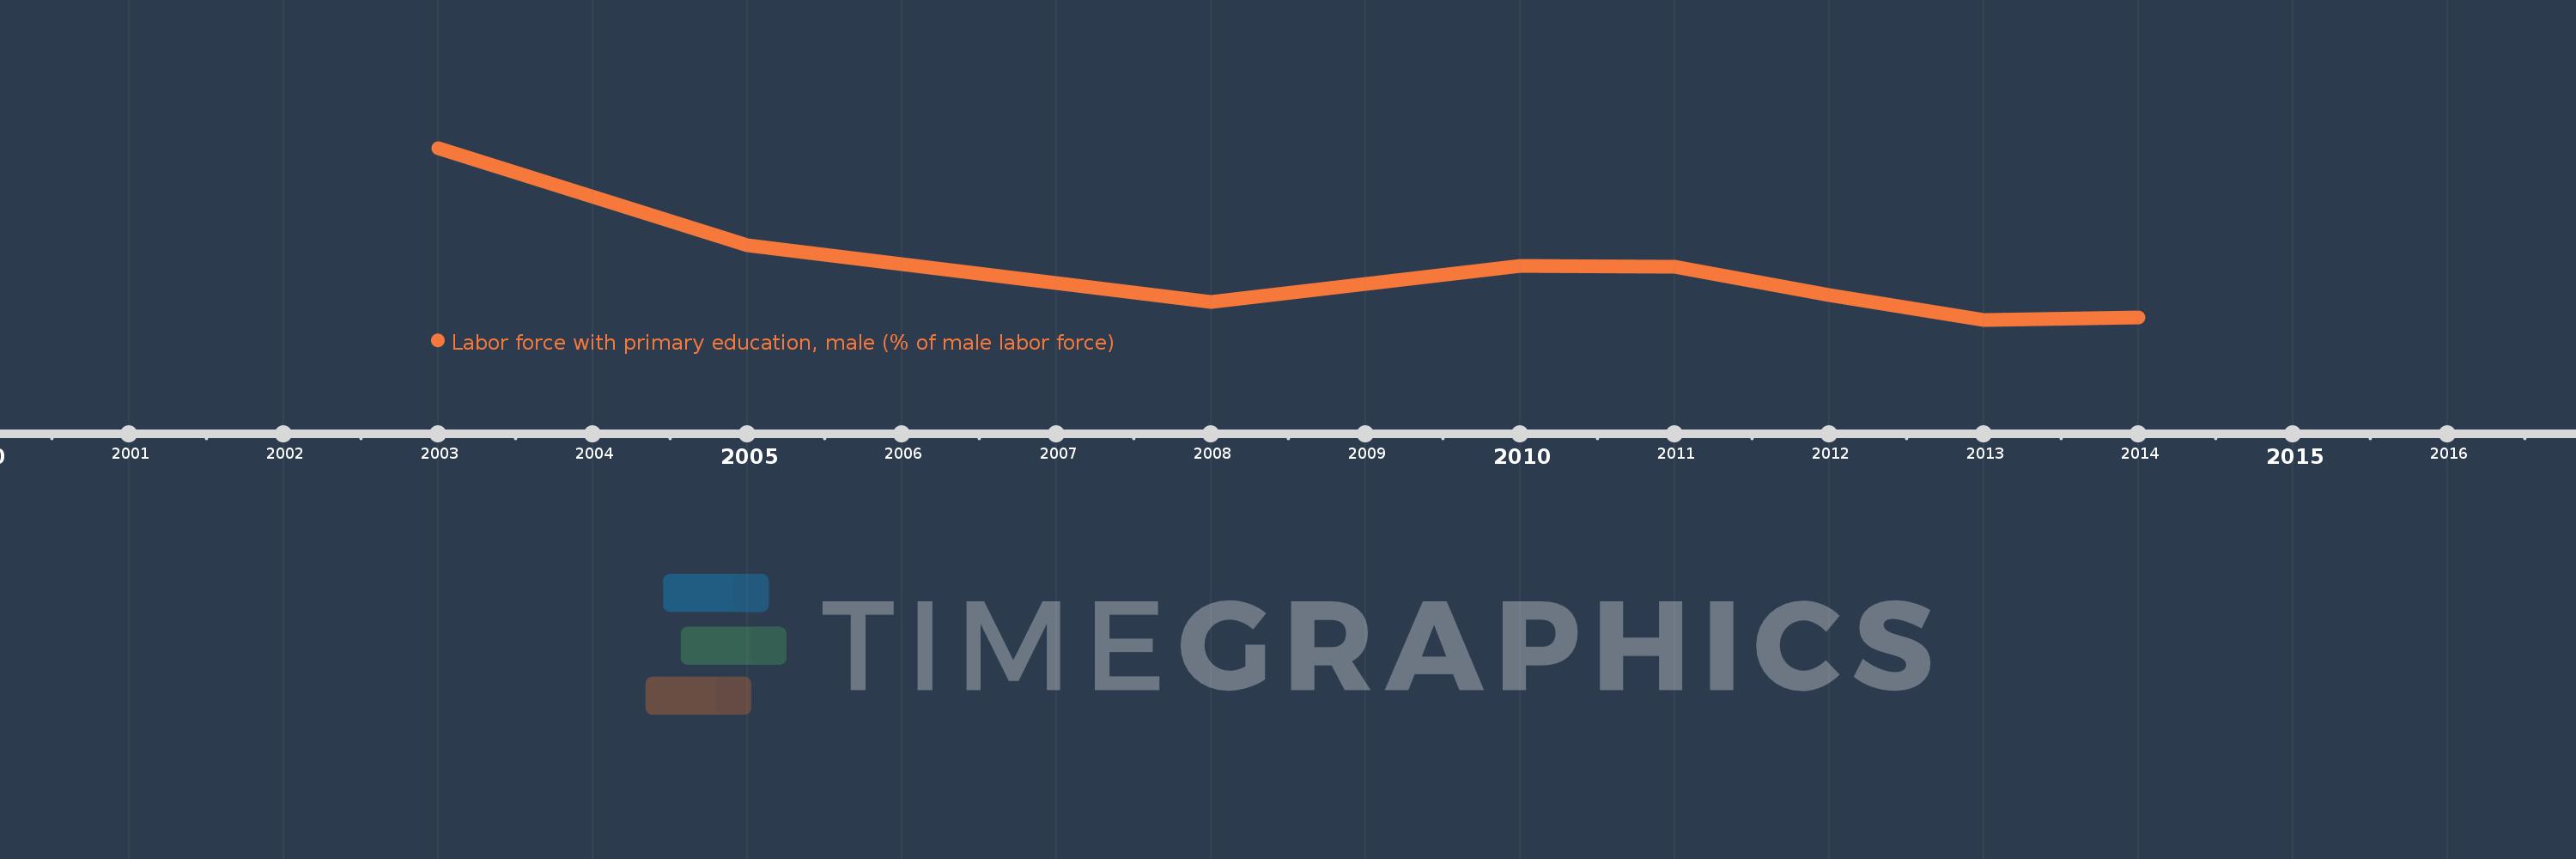
Labor force with primary education, male (% of male labor force)
2014,2013,2012,2011,2010,2008,2005,2003
This statistics in other country:
Timeline:
This timeline shows a graph from 2003 to 2014 of Europe & Central Asia (excluding high income). No data until 2002. Number of actual observations by date: 8.
Source name:
World Development Indicators
Source organization:
International Labour Organization, Key Indicators of the Labour Market database.
Categories, topics:
Education, Social Protection & Labor, Gender
Last updated:
apr 23, 2017
Indicators value changes by year
Minimum:
21.519
jan 1, 2013
Maximum:
25.563
jan 1, 2003
At the date of observation
Value
Absolute change
Change from previous value
jan 1, 2003
25.563
+25.563
0.0%
jan 1, 2005
23.266
-2.296
-8.98%
jan 1, 2008
21.938
-1.328
-5.71%
jan 1, 2010
22.795
+0.856
3.9%
jan 1, 2011
22.767
-0.028
-0.12%
jan 1, 2012
22.096
-0.671
-2.95%
jan 1, 2013
21.519
-0.577
-2.61%
jan 1, 2014
21.581
+0.063
0.29%
Ranking of countries by current statistics by years


Comments: