29
/
en
AIzaSyAYiBZKx7MnpbEhh9jyipgxe19OcubqV5w
April 1, 2024
30827
Europe & Central Asia
ECS
false
2
1
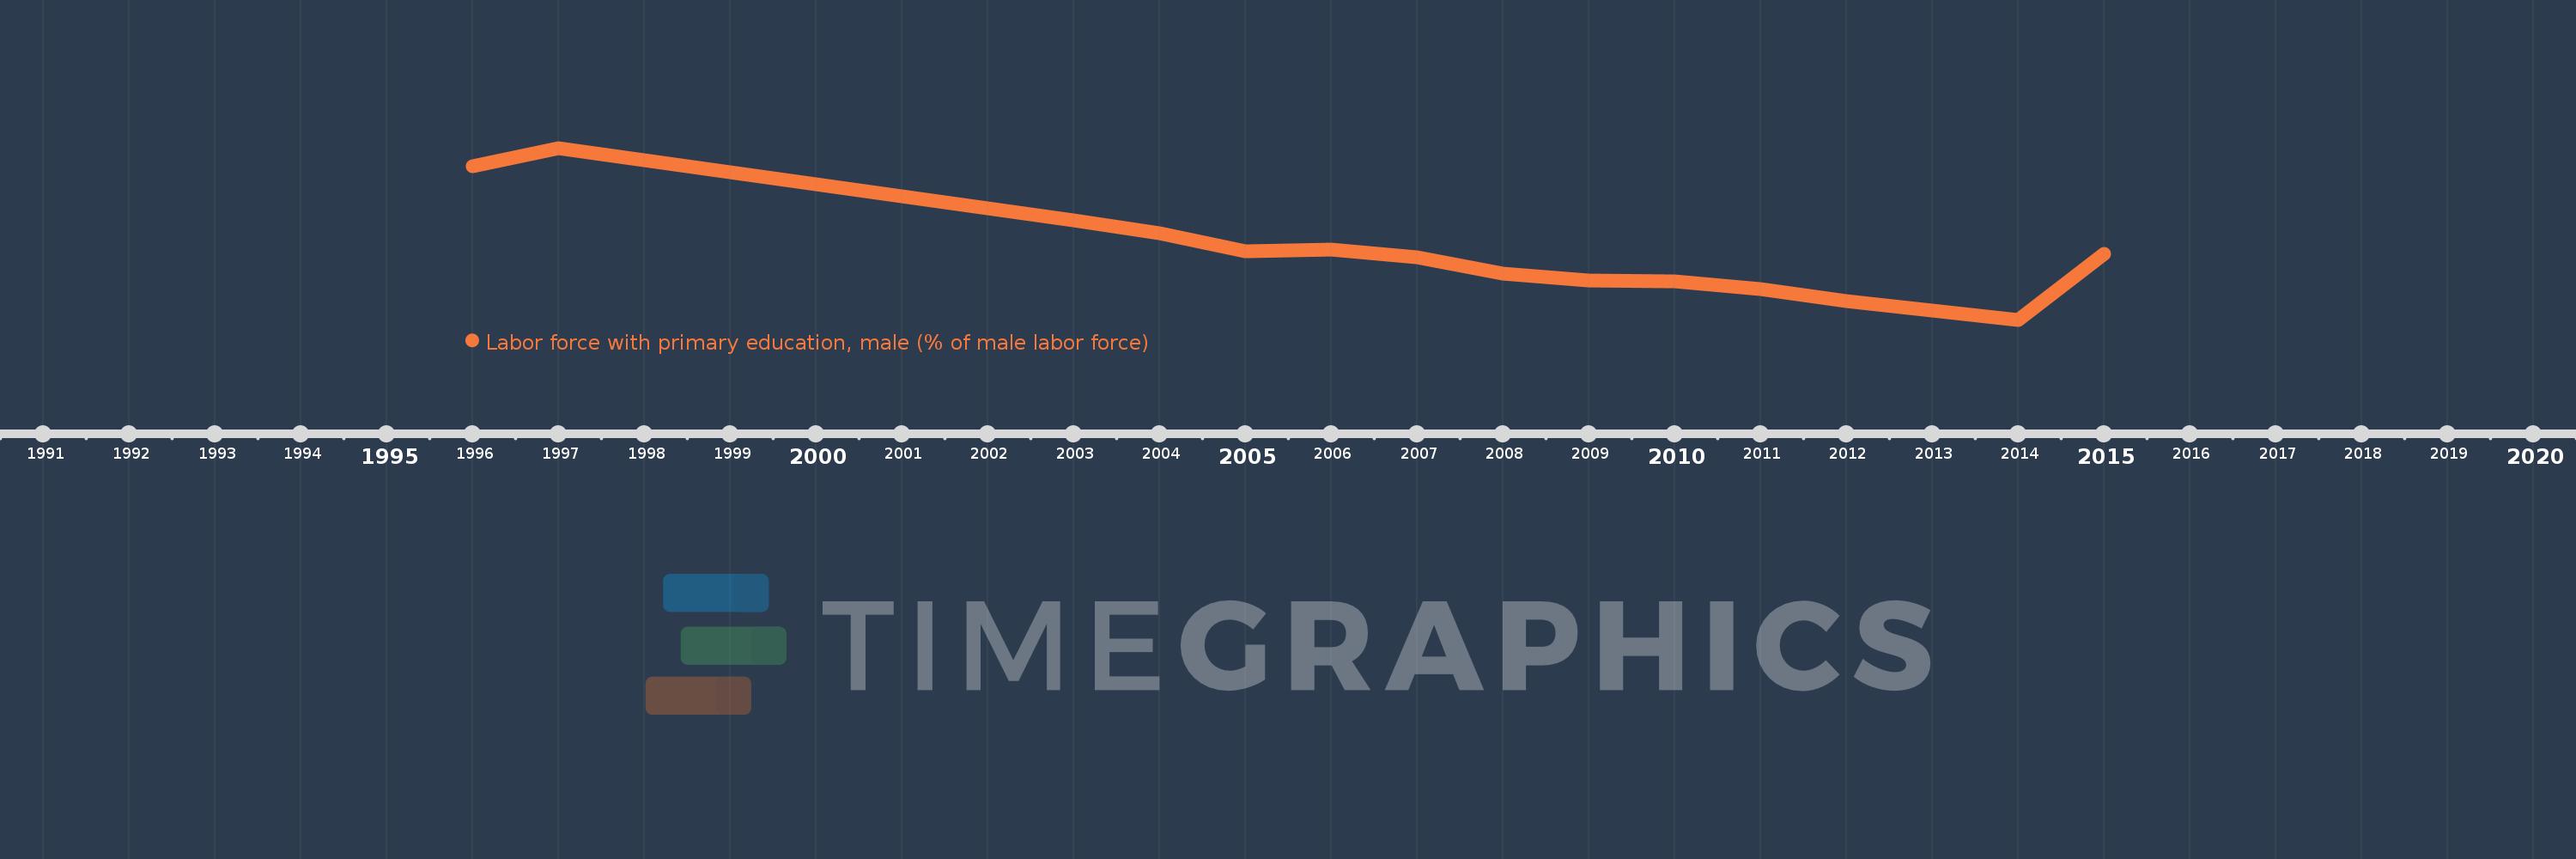
Labor force with primary education, male (% of male labor force)
2015,2014,2013,2012,2011,2010,2009,2008,2007,2006,2005,2004,2003,1997,1996
This statistics in other country:
Timeline:
This timeline shows a graph from 1996 to 2015 of Europe & Central Asia. No data until 1995. Number of actual observations by date: 15.
Source name:
World Development Indicators
Source organization:
International Labour Organization, Key Indicators of the Labour Market database.
Categories, topics:
Education, Social Protection & Labor, Gender
Last updated:
apr 23, 2017
Indicators value changes by year
Minimum:
20.943
jan 1, 2014
Maximum:
31.017
jan 1, 1997
At the date of observation
Value
Absolute change
Change from previous value
jan 1, 1996
29.933
+29.933
0.0%
jan 1, 1997
31.017
+1.085
3.62%
jan 1, 2003
26.763
-4.254
-13.72%
jan 1, 2004
26.021
-0.743
-2.77%
jan 1, 2005
24.978
-1.043
-4.01%
jan 1, 2006
25.073
+0.096
0.38%
jan 1, 2007
24.628
-0.445
-1.77%
jan 1, 2008
23.656
-0.973
-3.95%
jan 1, 2009
23.222
-0.433
-1.83%
jan 1, 2010
23.191
-0.031
-0.13%
jan 1, 2011
22.741
-0.45
-1.94%
jan 1, 2012
22.056
-0.685
-3.01%
jan 1, 2013
21.465
-0.592
-2.68%
jan 1, 2014
20.943
-0.522
-2.43%
jan 1, 2015
24.806
+3.863
18.45%
Ranking of countries by current statistics by years


Comments: