29
/
en
AIzaSyAYiBZKx7MnpbEhh9jyipgxe19OcubqV5w
April 1, 2024
30004
Euro area
EMU
false
2
1
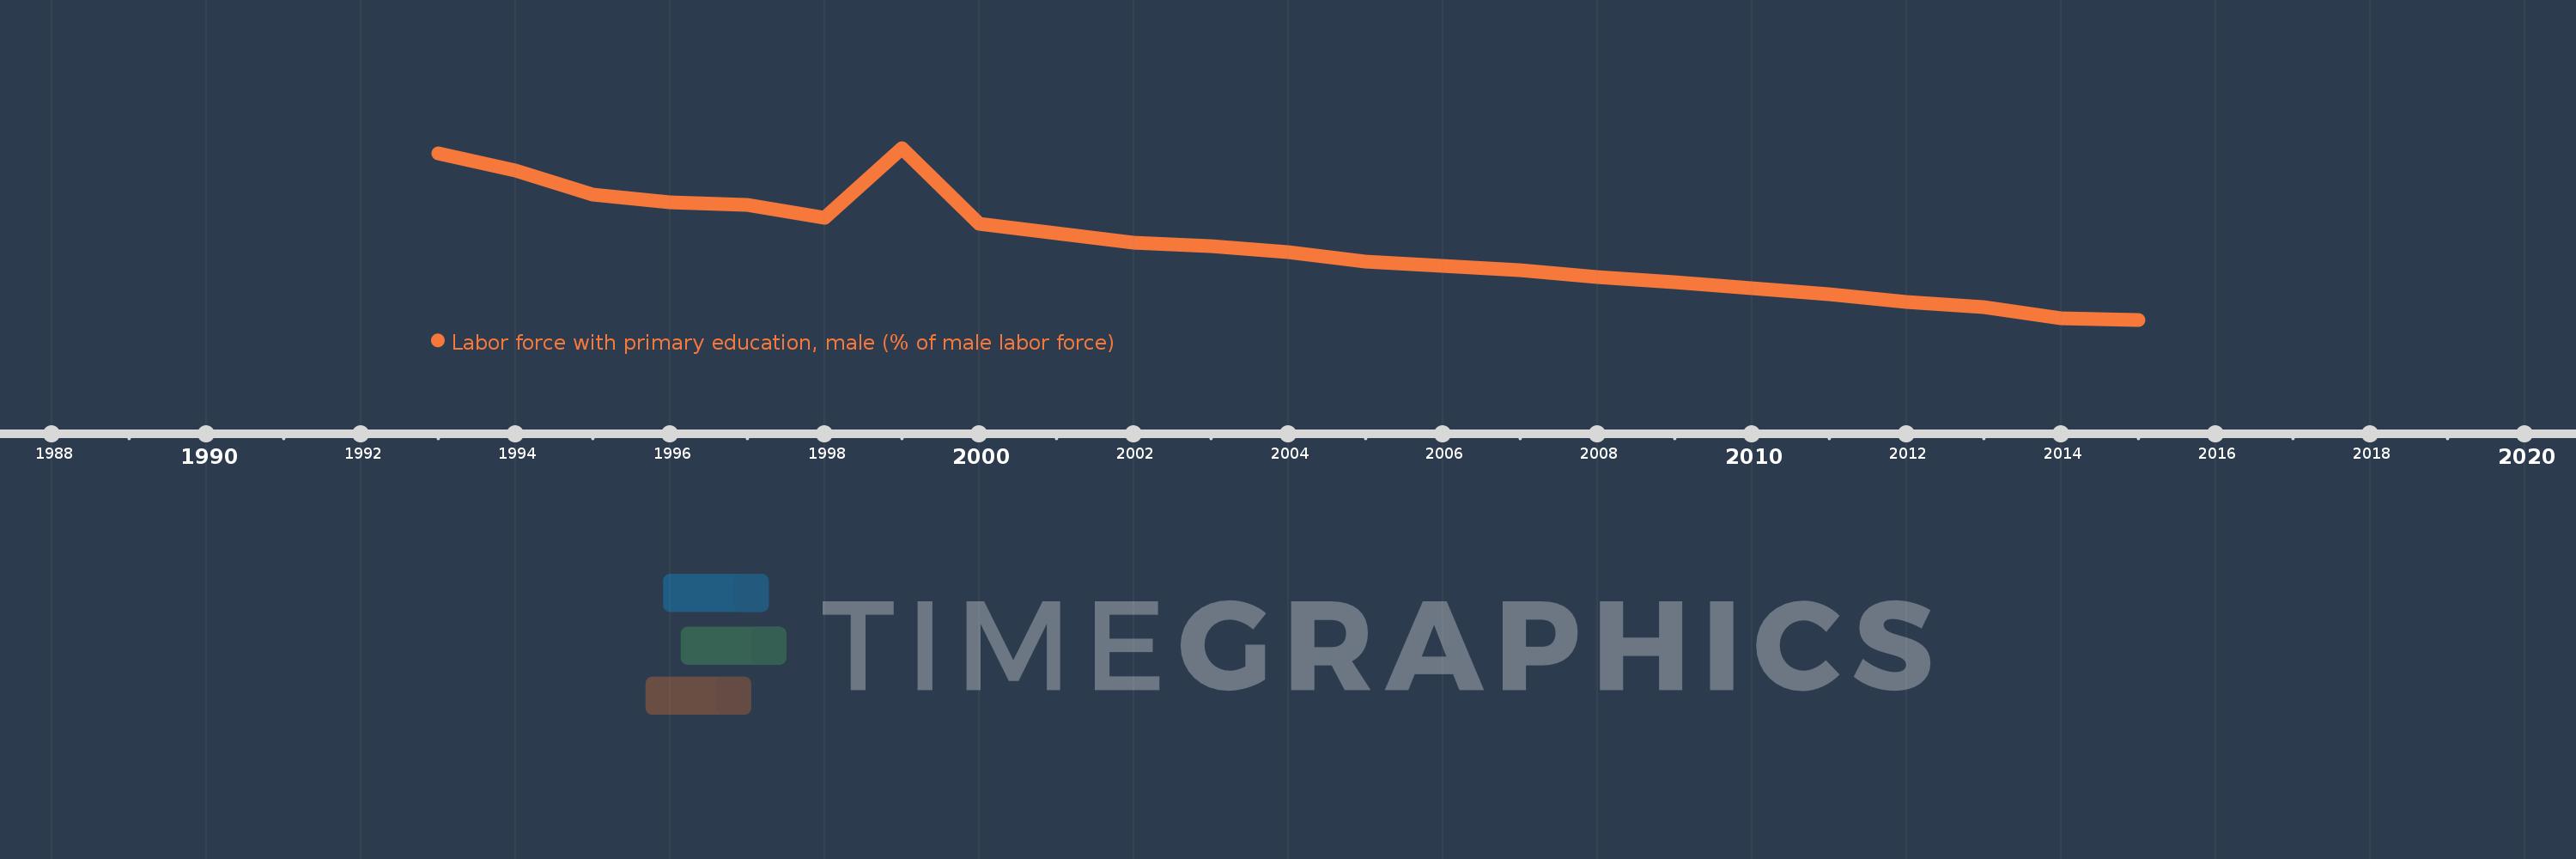
Labor force with primary education, male (% of male labor force)
2015,2014,2013,2012,2011,2010,2009,2008,2007,2006,2005,2004,2003,2002,2001,2000,1999,1998,1997,1996,1995,1994,1993
This statistics in other country:
Timeline:
This timeline shows a graph from 1993 to 2015 of Euro area. No data until 1992. Number of actual observations by date: 23.
Source name:
World Development Indicators
Source organization:
International Labour Organization, Key Indicators of the Labour Market database.
Categories, topics:
Education, Social Protection & Labor, Gender
Last updated:
apr 23, 2017
Indicators value changes by year
Minimum:
25.652
jan 1, 2015
At the date of observation
Value
Absolute change
Change from previous value
jan 1, 1993
44.101
+44.101
0.0%
jan 1, 1994
42.197
-1.904
-4.32%
jan 1, 1995
39.518
-2.68
-6.35%
jan 1, 1996
38.626
-0.892
-2.26%
jan 1, 1997
38.357
-0.269
-0.7%
jan 1, 1998
36.96
-1.398
-3.64%
jan 1, 1999
44.68
+7.72
20.89%
jan 1, 2000
36.237
-8.443
-18.9%
jan 1, 2001
35.193
-1.044
-2.88%
jan 1, 2002
34.196
-0.997
-2.83%
jan 1, 2003
33.829
-0.367
-1.07%
jan 1, 2004
33.105
-0.725
-2.14%
jan 1, 2005
32.136
-0.968
-2.93%
jan 1, 2006
31.571
-0.566
-1.76%
jan 1, 2007
31.157
-0.413
-1.31%
jan 1, 2008
30.351
-0.807
-2.59%
jan 1, 2009
29.764
-0.586
-1.93%
jan 1, 2010
29.146
-0.619
-2.08%
jan 1, 2011
28.466
-0.68
-2.33%
jan 1, 2012
27.604
-0.862
-3.03%
jan 1, 2013
27.024
-0.58
-2.1%
jan 1, 2014
25.839
-1.185
-4.39%
jan 1, 2015
25.652
-0.186
-0.72%
Ranking of countries by current statistics by years


Comments: