29
/
en
AIzaSyAYiBZKx7MnpbEhh9jyipgxe19OcubqV5w
April 1, 2024
256523
Sweden
SWE
true
2
1
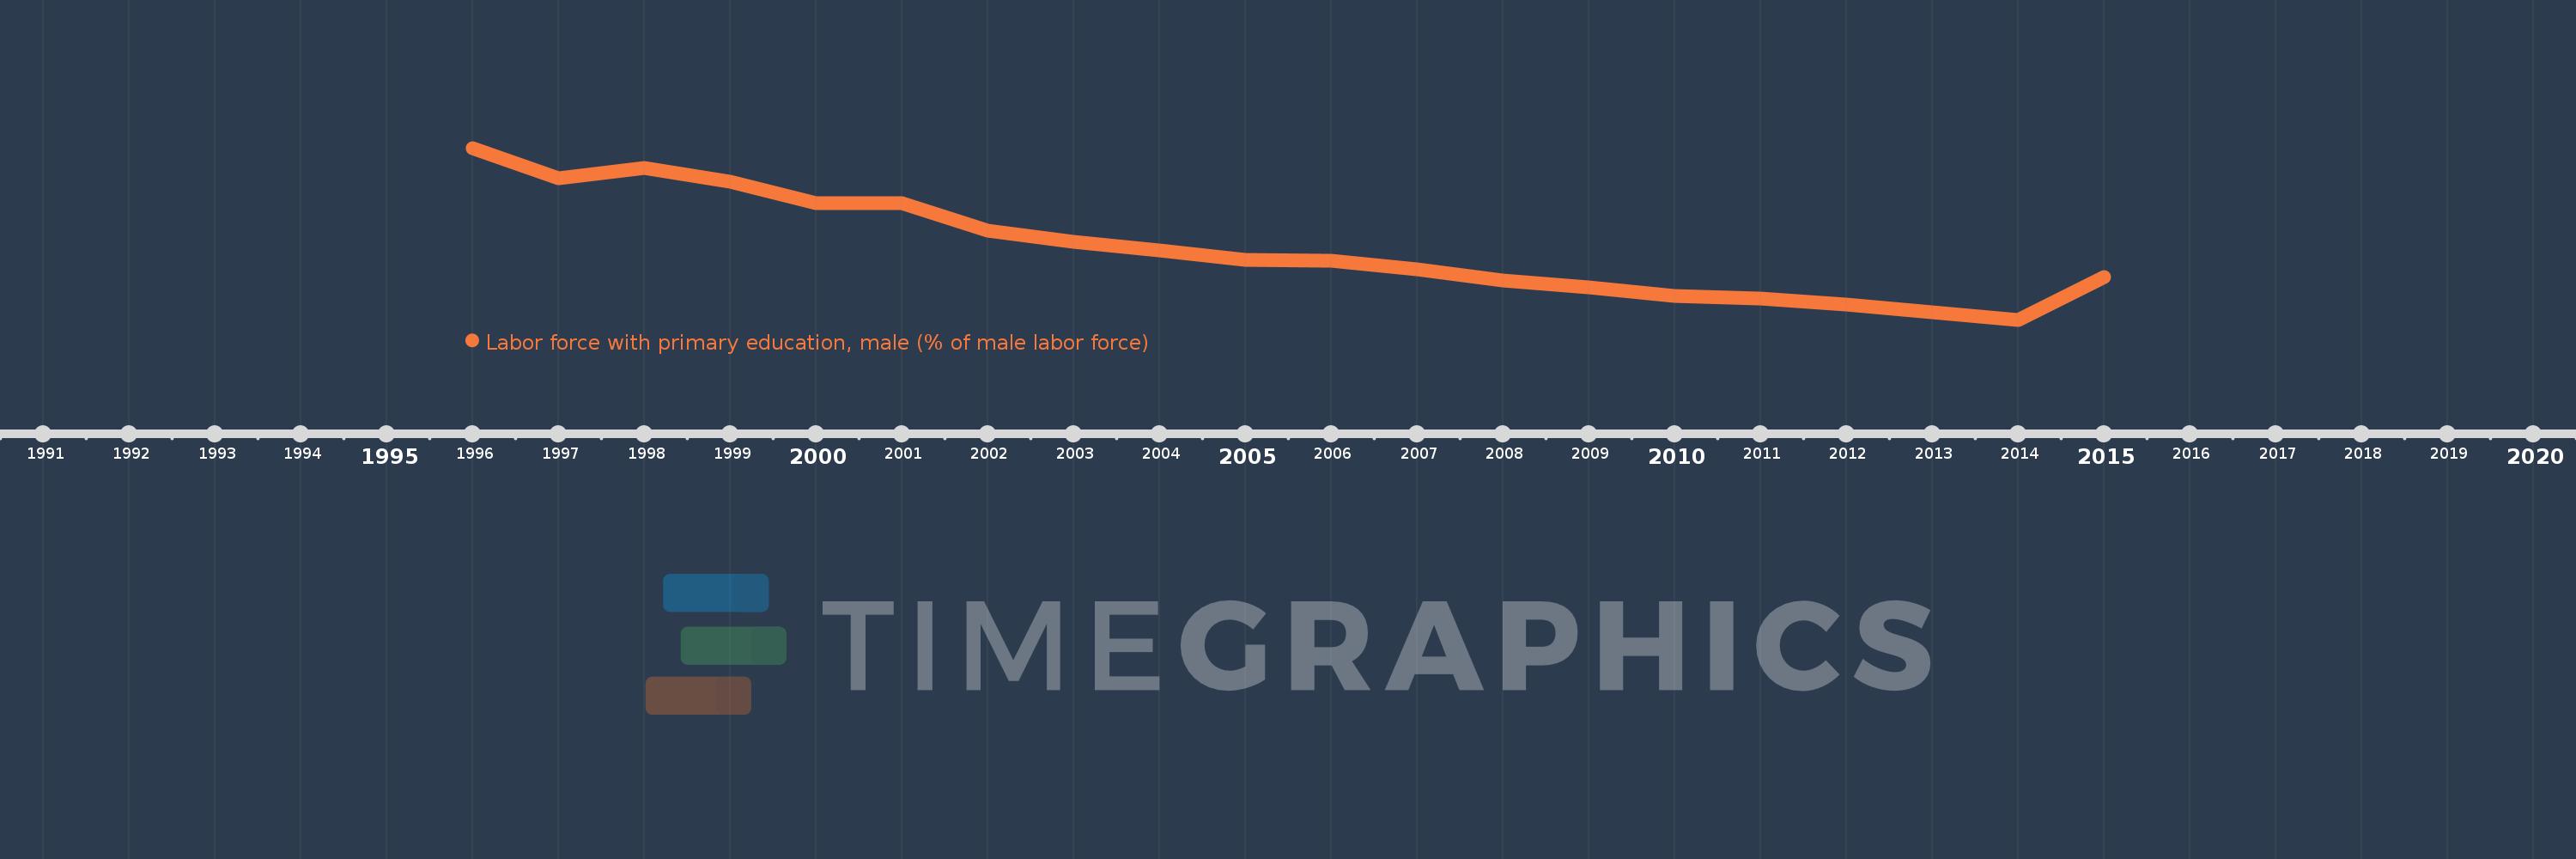
Labor force with primary education, male (% of male labor force)
2015,2014,2013,2012,2011,2010,2009,2008,2007,2006,2005,2004,2003,2002,2001,2000,1999,1998,1997,1996
This statistics in other country:
Timeline:
This timeline shows a graph from 1996 to 2015 of Sweden. No data until 1995. Number of actual observations by date: 20.
Source name:
World Development Indicators
Source organization:
International Labour Organization, Key Indicators of the Labour Market database.
Categories, topics:
Education, Social Protection & Labor, Gender
Last updated:
apr 23, 2017
Indicators value changes by year
At the date of observation
Value
Absolute change
Change from previous value
jan 1, 1996
27.6
+27.6
0.0%
jan 1, 1997
25.2
-2.4
-8.7%
jan 1, 1998
26.0
+0.8
3.17%
jan 1, 1999
24.9
-1.1
-4.23%
jan 1, 2000
23.2
-1.7
-6.83%
jan 1, 2002
21.0
-2.2
-9.48%
jan 1, 2003
20.1
-0.9
-4.29%
jan 1, 2004
19.4
-0.7
-3.48%
jan 1, 2005
18.7
-0.7
-3.61%
jan 1, 2006
18.6
-0.1
-0.53%
jan 1, 2007
17.9
-0.7
-3.76%
jan 1, 2008
17.0
-0.9
-5.03%
jan 1, 2009
16.5
-0.5
-2.94%
jan 1, 2010
15.8
-0.7
-4.24%
jan 1, 2011
15.6
-0.2
-1.27%
jan 1, 2012
15.1
-0.5
-3.21%
jan 1, 2013
14.5
-0.6
-3.97%
jan 1, 2014
13.9
-0.6
-4.14%
jan 1, 2015
17.3
+3.4
24.46%
Ranking of countries by current statistics by years


Comments: