29
/
en
AIzaSyAYiBZKx7MnpbEhh9jyipgxe19OcubqV5w
April 1, 2024
112466
Costa Rica
CRI
true
2
1
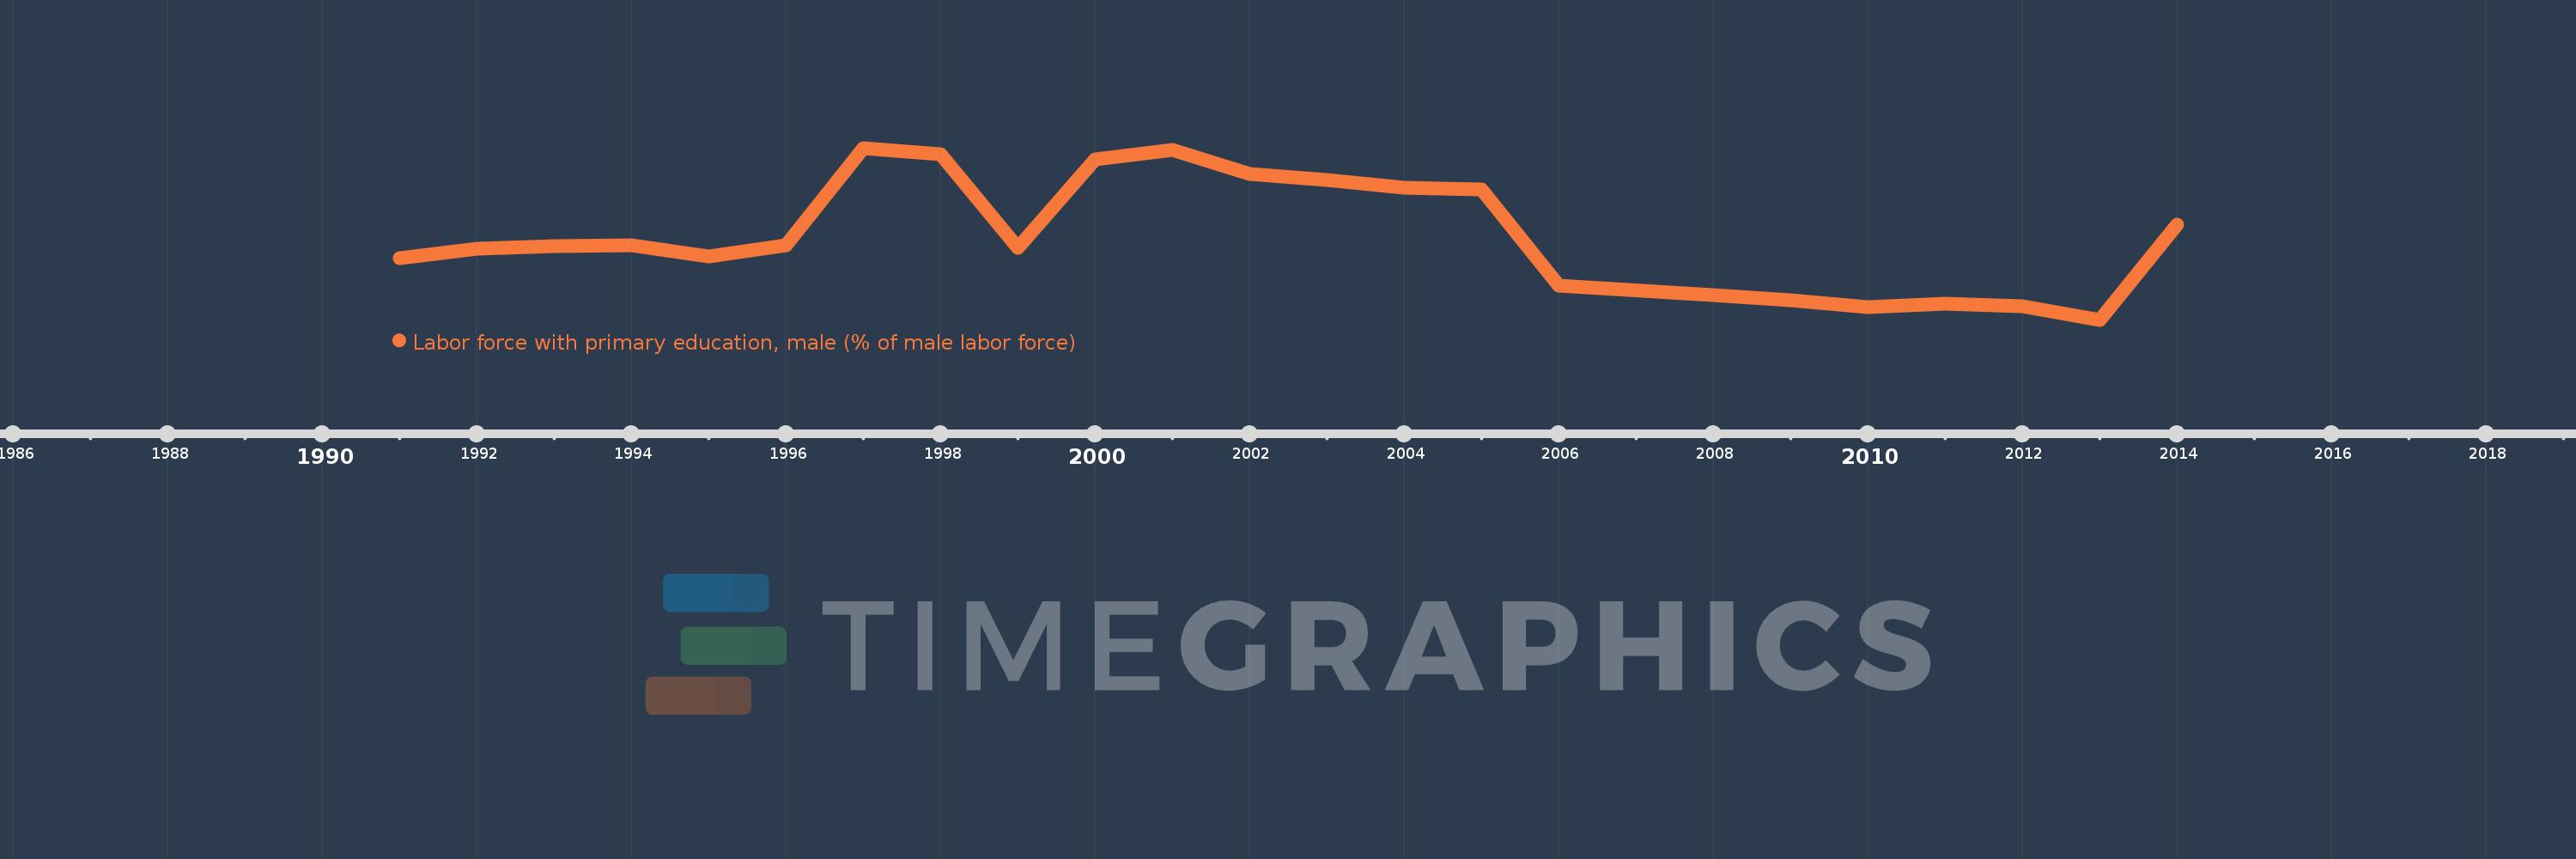
Labor force with primary education, male (% of male labor force)
2014,2013,2012,2011,2010,2009,2008,2006,2005,2004,2003,2002,2001,2000,1999,1998,1997,1996,1995,1994,1993,1992,1991
This statistics in other country:
Timeline:
This timeline shows a graph from 1991 to 2014 of Costa Rica. No data until 1990. Number of actual observations by date: 23.
Source name:
World Development Indicators
Source organization:
International Labour Organization, Key Indicators of the Labour Market database.
Categories, topics:
Education, Social Protection & Labor, Gender
Last updated:
apr 23, 2017
Indicators value changes by year
At the date of observation
Value
Absolute change
Change from previous value
jan 1, 1991
50.0
+50.0
0.0%
jan 1, 1992
51.6
+1.6
3.2%
jan 1, 1993
52.0
+0.4
0.78%
jan 1, 1994
52.2
+0.2
0.38%
jan 1, 1995
50.3
-1.9
-3.64%
jan 1, 1996
52.1
+1.8
3.58%
jan 1, 1997
68.8
+16.7
32.05%
jan 1, 1998
67.7
-1.1
-1.6%
jan 1, 1999
51.7
-16.0
-23.63%
jan 1, 2000
66.9
+15.2
29.4%
jan 1, 2001
68.4
+1.5
2.24%
jan 1, 2002
64.4
-4.0
-5.85%
jan 1, 2003
63.3
-1.1
-1.71%
jan 1, 2004
62.0
-1.3
-2.05%
jan 1, 2005
61.7
-0.3
-0.48%
jan 1, 2006
45.3
-16.4
-26.58%
jan 1, 2008
43.6
-1.7
-3.75%
jan 1, 2009
42.8
-0.8
-1.83%
jan 1, 2010
41.5
-1.3
-3.04%
jan 1, 2011
42.1
+0.6
1.45%
jan 1, 2012
41.7
-0.4
-0.95%
jan 1, 2013
39.4
-2.3
-5.52%
jan 1, 2014
55.7
+16.3
41.37%
Ranking of countries by current statistics by years


Comments: