29
/
en
AIzaSyAYiBZKx7MnpbEhh9jyipgxe19OcubqV5w
April 1, 2024
269546
Turkey
TUR
true
2
1
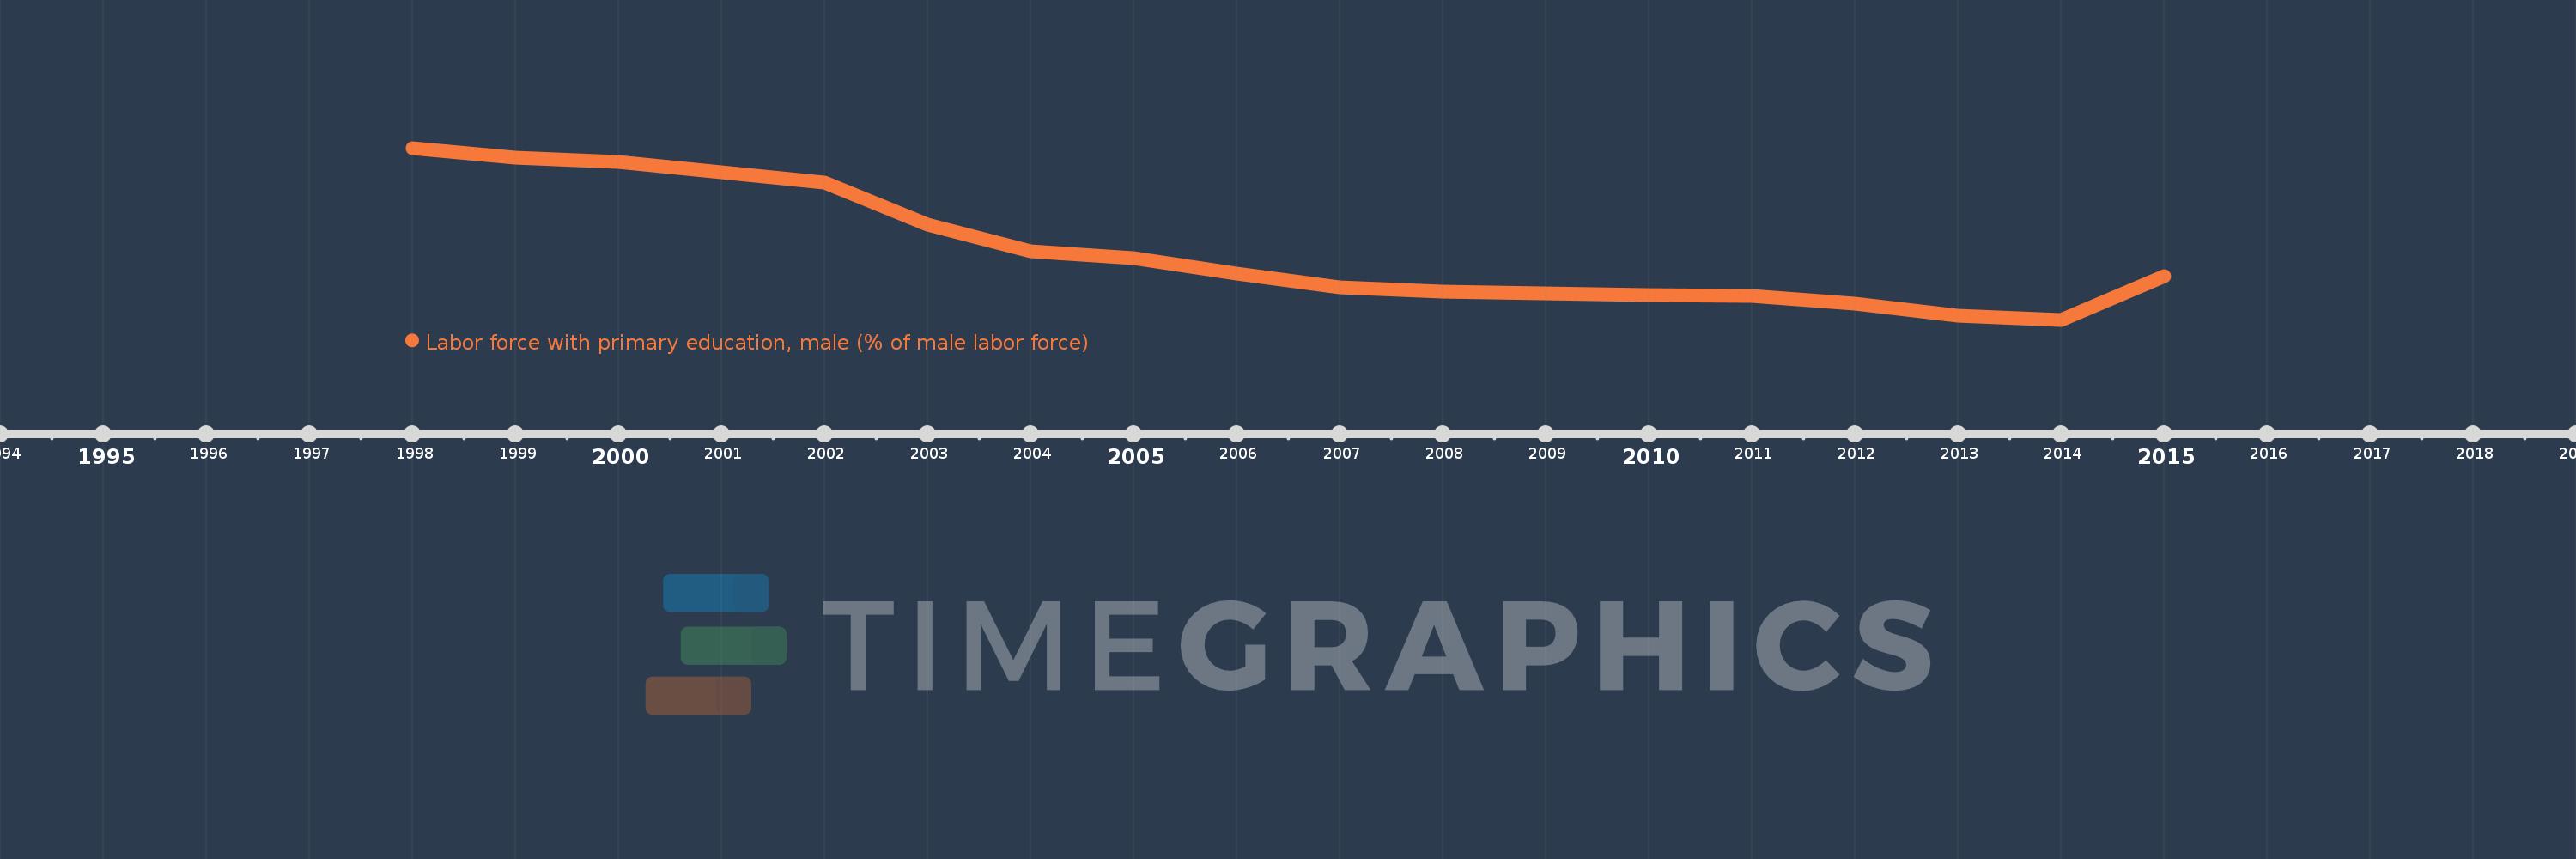
Labor force with primary education, male (% of male labor force)
2015,2014,2013,2012,2011,2010,2009,2008,2007,2006,2005,2004,2003,2002,2001,2000,1999,1998
This statistics in other country:
Timeline:
This timeline shows a graph from 1998 to 2015 of Turkey. No data until 1997. Number of actual observations by date: 18.
Source name:
World Development Indicators
Source organization:
International Labour Organization, Key Indicators of the Labour Market database.
Categories, topics:
Education, Social Protection & Labor, Gender
Last updated:
apr 23, 2017
Indicators value changes by year
At the date of observation
Value
Absolute change
Change from previous value
jan 1, 1998
75.5
+75.5
0.0%
jan 1, 1999
74.4
-1.1
-1.46%
jan 1, 2000
73.9
-0.5
-0.67%
jan 1, 2001
72.7
-1.2
-1.62%
jan 1, 2002
71.5
-1.2
-1.65%
jan 1, 2003
66.6
-4.9
-6.85%
jan 1, 2004
63.5
-3.1
-4.65%
jan 1, 2005
62.7
-0.8
-1.26%
jan 1, 2006
60.9
-1.8
-2.87%
jan 1, 2007
59.3
-1.6
-2.63%
jan 1, 2008
58.8
-0.5
-0.84%
jan 1, 2009
58.6
-0.2
-0.34%
jan 1, 2010
58.4
-0.2
-0.34%
jan 1, 2011
58.3
-0.1
-0.17%
jan 1, 2012
57.4
-0.9
-1.54%
jan 1, 2013
56.0
-1.4
-2.44%
jan 1, 2014
55.5
-0.5
-0.89%
jan 1, 2015
60.6
+5.1
9.19%
Ranking of countries by current statistics by years


Comments: