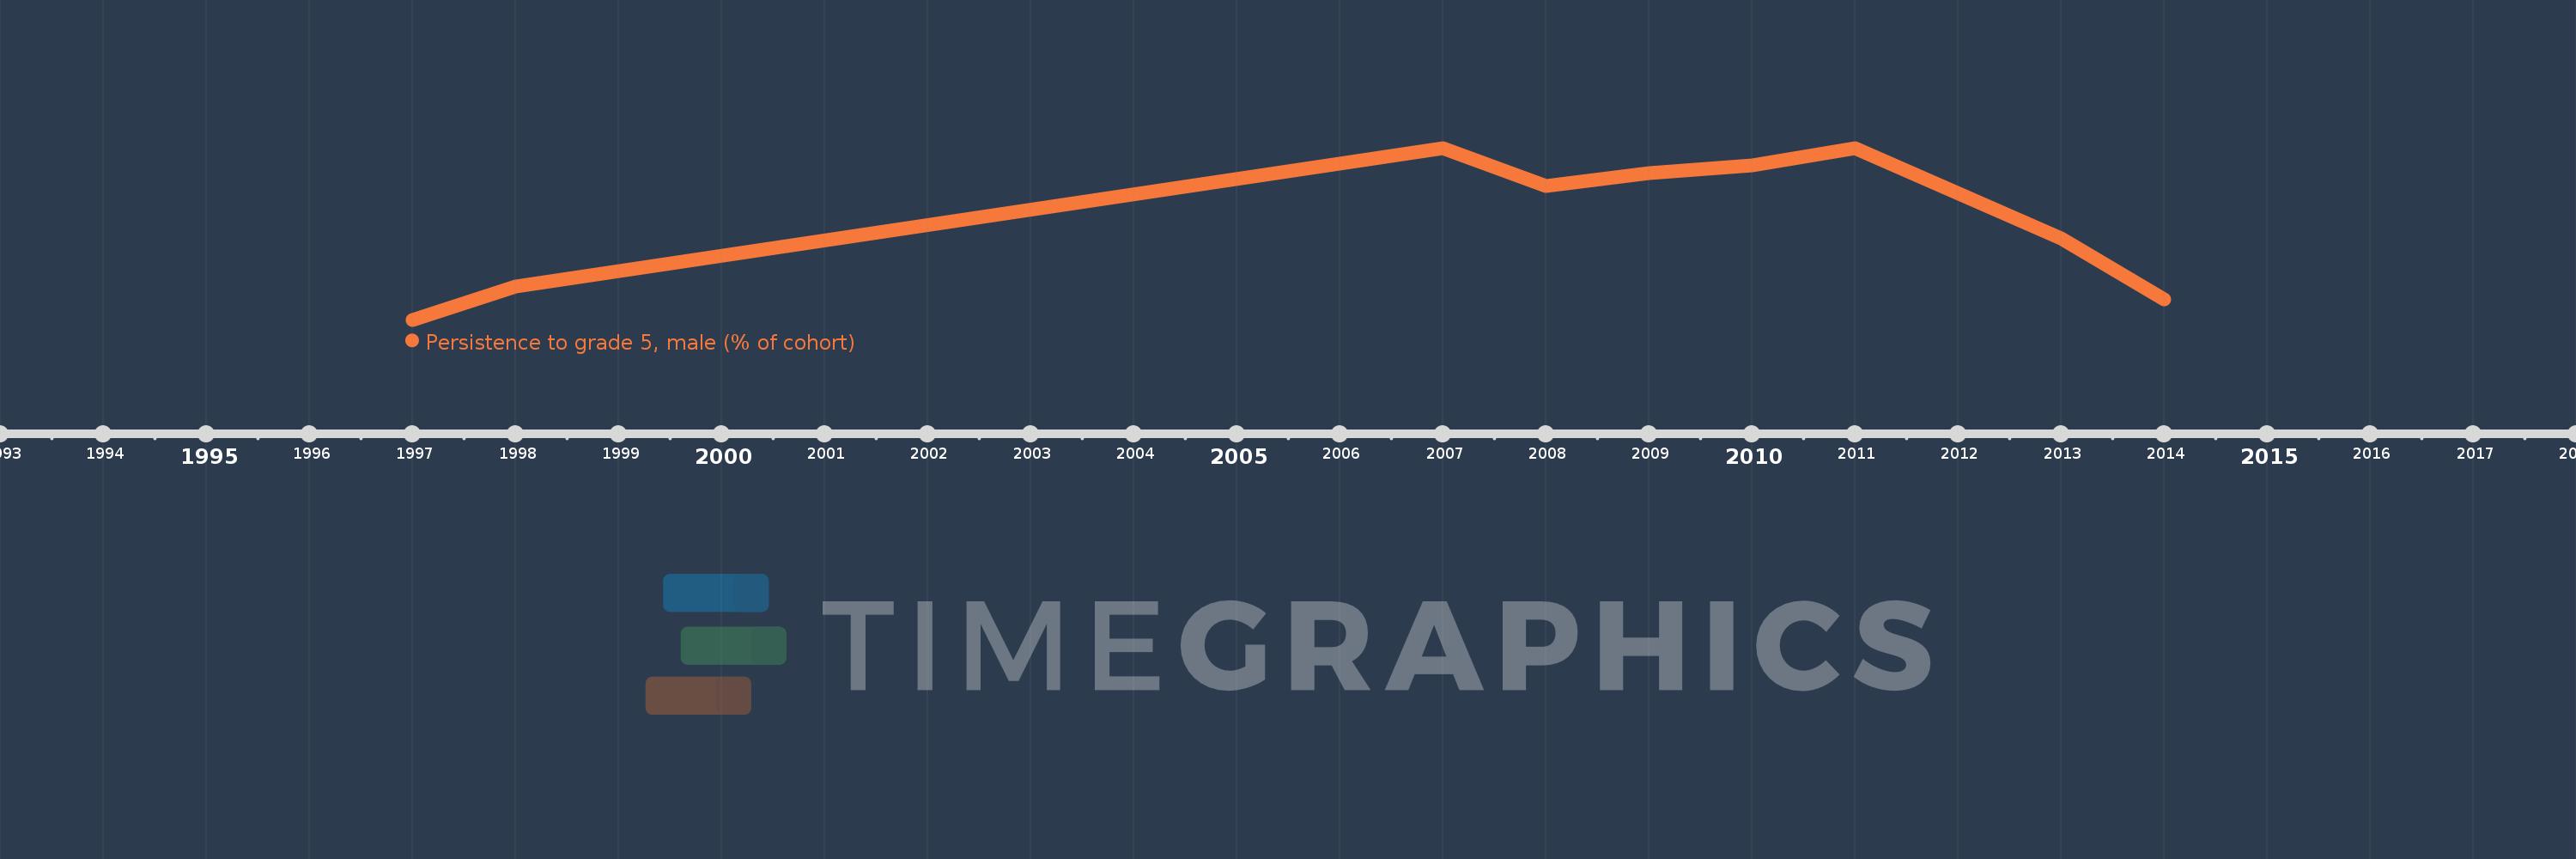
This timeline shows a graph from 1997 to 2014 of East Asia & Pacific (excluding high income). No data until 1996. Number of actual observations by date: 9.
Source name:
World Development Indicators
Source organization:
United Nations Educational, Scientific, and Cultural Organization (UNESCO) Institute for Statistics.
Categories, topics:
Education, Gender
Last updated:
apr 23, 2017
Indicators value changes by year
Meaning:
89.329
Minimum:
80.021
jan 1, 1997
Maximum:
95.776
jan 1, 2007
At the date of observation
Value
Absolute change
Change from the previous value
jan 1, 1997
80.021
+80.021
0.0%
jan 1, 1998
83.053
+3.032
3.79%
jan 1, 2007
95.776
+12.723
15.32%
jan 1, 2008
92.323
-3.453
-3.61%
jan 1, 2009
93.501
+1.178
1.28%
jan 1, 2010
94.138
+0.638
0.68%
jan 1, 2011
95.722
+1.584
1.68%
jan 1, 2013
87.517
-8.205
-8.57%
jan 1, 2014
81.906
-5.611
-6.41%
Ranking of countries by current statistics by years
