29
/
en
AIzaSyAYiBZKx7MnpbEhh9jyipgxe19OcubqV5w
April 1, 2024
66476
Algeria
DZA
true
2
1
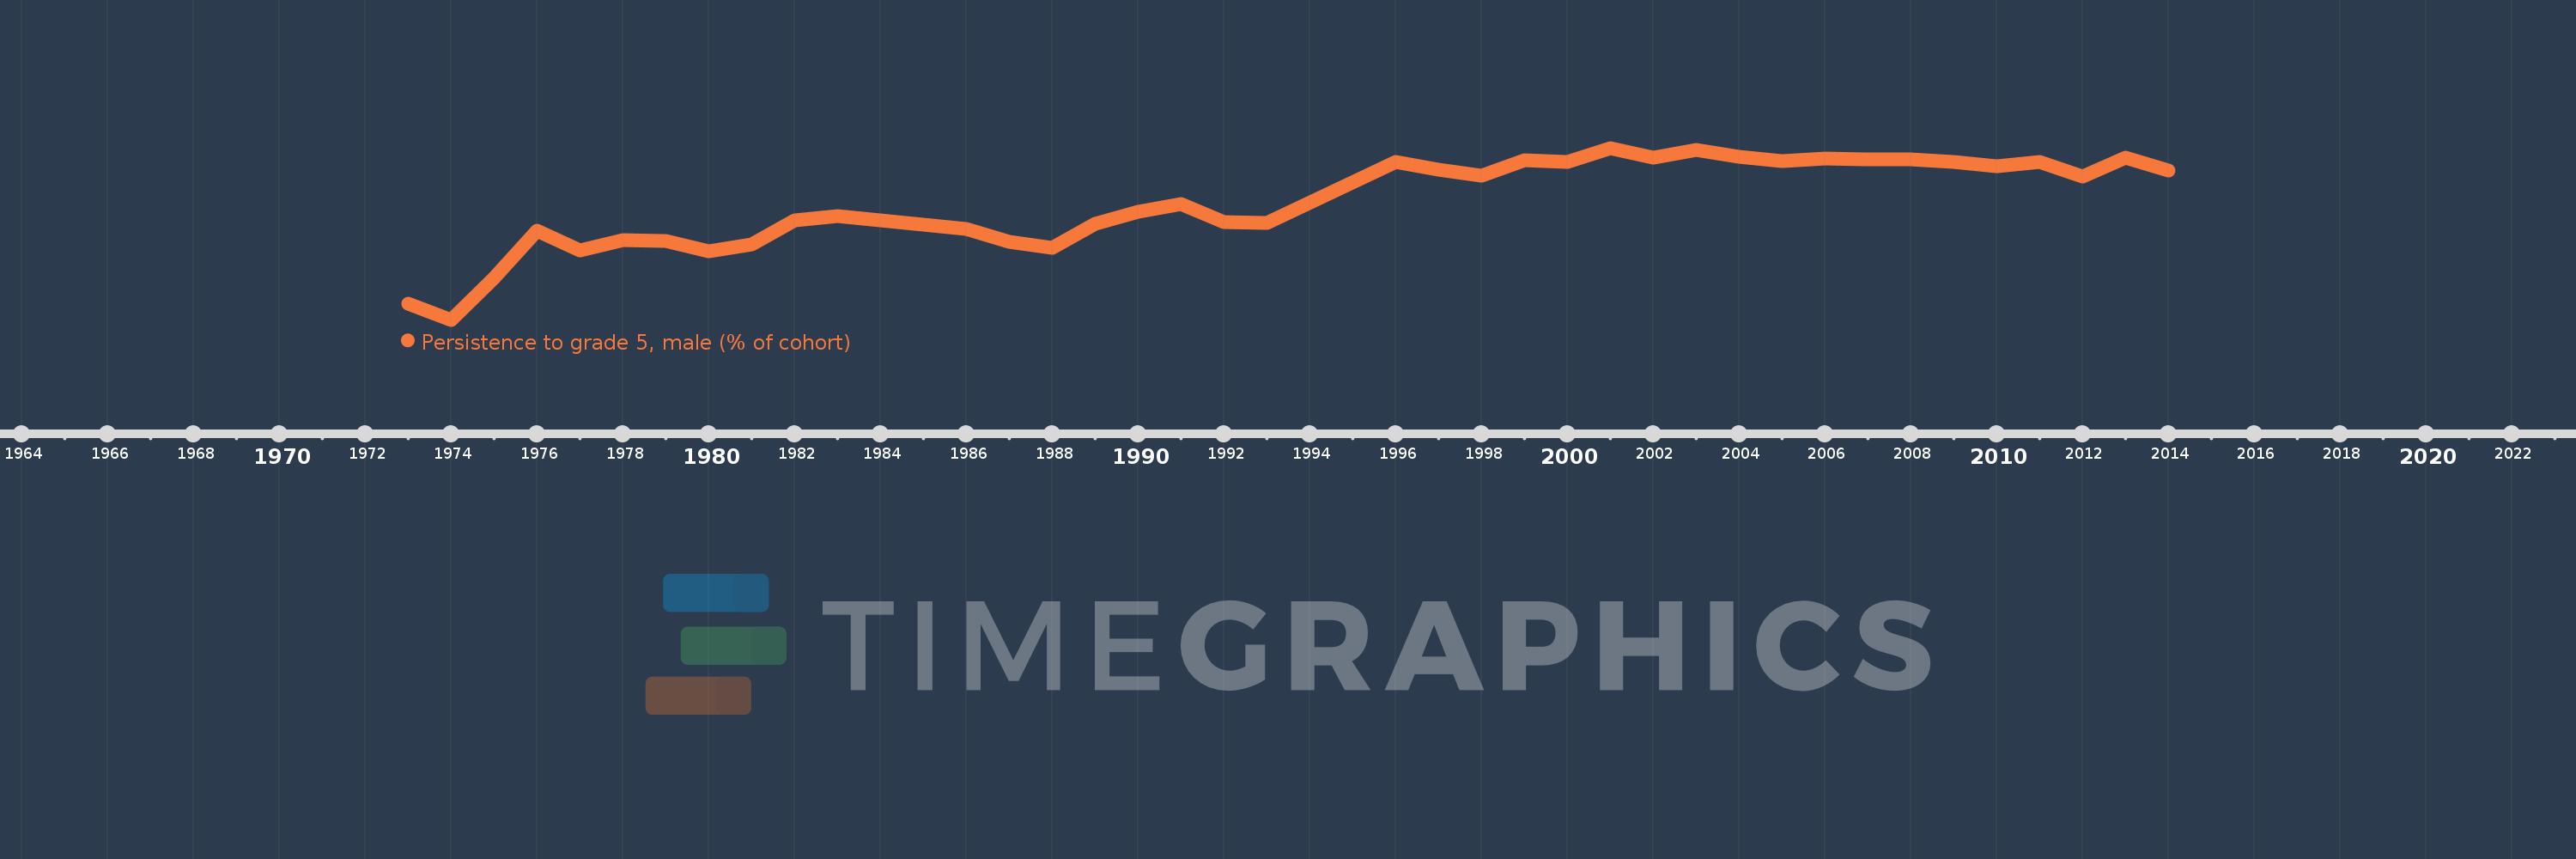
Persistence to grade 5, male (% of cohort)
2014,2013,2012,2011,2010,2009,2008,2007,2006,2005,2004,2003,2002,2001,2000,1999,1998,1997,1996,1993,1992,1991,1990,1989,1988,1987,1986,1983,1982,1981,1980,1979,1978,1977,1976,1975,1974,1973
This statistics in other country:
AfghanistanAlbaniaAlgeriaAndorraAngolaAntigua and BarbudaArab WorldArgentinaArubaBahamas, TheBahrainBangladeshBarbadosBelgiumBelizeBeninBermudaBhutanBoliviaBosnia and HerzegovinaBotswanaBrunei DarussalamBurkina FasoBurundiCabo VerdeCambodiaCameroonCanadaCaribbean small statesCayman IslandsCentral African RepublicChadChileChinaColombiaComorosCongo, Dem. Rep.Congo, Rep.Costa RicaCote d'IvoireCubaCyprusCzech RepublicDenmarkDjiboutiDominicaDominican RepublicEarly-demographic dividendEast Asia & PacificEast Asia & Pacific (excluding high income)East Asia & Pacific (IDA & IBRD countries)EcuadorEgypt, Arab Rep.El SalvadorEquatorial GuineaEritreaEstoniaEthiopiaFijiFinlandFranceGabonGambia, TheGeorgiaGhanaGreeceGrenadaGuatemalaGuineaGuinea-BissauGuyanaHaitiHeavily indebted poor countries (HIPC)HondurasHong Kong SAR, ChinaHungaryIcelandIDA blendIDA onlyIDA totalIndiaIndonesiaIran, Islamic Rep.IraqIrelandIsraelItalyJamaicaJapanJordanKenyaKiribatiKorea, Rep.KuwaitLao PDRLate-demographic dividendLatviaLeast developed countries: UN classificationLebanonLesothoLiberiaLibyaLiechtensteinLow incomeLower middle incomeLuxembourgMacao SAR, ChinaMadagascarMalawiMalaysiaMaldivesMaliMaltaMarshall IslandsMauritaniaMauritiusMexicoMiddle East & North AfricaMiddle East & North Africa (excluding high income)Middle East & North Africa (IDA & IBRD countries)MontenegroMoroccoMozambiqueMyanmarNamibiaNepalNetherlandsNicaraguaNigerNigeriaNorwayOmanOther small statesPacific island small statesPakistanPanamaPapua New GuineaParaguayPeruPhilippinesPolandPortugalPre-demographic dividendQatarRwandaSamoaSan MarinoSao Tome and PrincipeSaudi ArabiaSenegalSeychellesSierra LeoneSingaporeSloveniaSolomon IslandsSouth AfricaSouth AsiaSouth Asia (IDA & IBRD)SpainSri LankaSt. Kitts and NevisSt. LuciaSt. Vincent and the GrenadinesSub-Saharan Africa Sub-Saharan Africa (excluding high income)Sub-Saharan Africa (IDA & IBRD countries)SudanSurinameSwazilandSwedenSwitzerlandSyrian Arab RepublicTanzaniaThailandTimor-LesteTogoTongaTrinidad and TobagoTunisiaTurkeyUgandaUnited Arab EmiratesUpper middle incomeUruguayVanuatuVenezuela, RBVietnamYemen, Rep.ZambiaZimbabwe Timeline:
This timeline shows a graph from 1973 to 2014 of Algeria. No data until 1972. Number of actual observations by date: 38.
Source name:
World Development Indicators
Source organization:
United Nations Educational, Scientific, and Cultural Organization (UNESCO) Institute for Statistics.
Categories, topics:
Education, Gender
Last updated:
apr 23, 2017
Indicators value changes by year
Minimum:
62.815
jan 1, 1974
Maximum:
96.808
jan 1, 2001
At the date of observation
Value
Absolute change
Change from previous value
jan 1, 1973
66.076
+66.076
0.0%
jan 1, 1974
62.815
-3.261
-4.93%
jan 1, 1975
71.089
+8.274
13.17%
jan 1, 1976
80.369
+9.28
13.05%
jan 1, 1977
76.559
-3.811
-4.74%
jan 1, 1978
78.603
+2.045
2.67%
jan 1, 1979
78.343
-0.261
-0.33%
jan 1, 1980
76.408
-1.935
-2.47%
jan 1, 1981
77.644
+1.236
1.62%
jan 1, 1982
82.506
+4.862
6.26%
jan 1, 1983
83.369
+0.863
1.05%
jan 1, 1986
80.823
-2.546
-3.05%
jan 1, 1987
78.246
-2.576
-3.19%
jan 1, 1988
77.071
-1.176
-1.5%
jan 1, 1989
81.783
+4.712
6.11%
jan 1, 1990
84.183
+2.4
2.93%
jan 1, 1991
85.659
+1.477
1.75%
jan 1, 1992
82.098
-3.561
-4.16%
jan 1, 1993
81.904
-0.194
-0.24%
jan 1, 1996
94.101
+12.197
14.89%
jan 1, 1997
92.509
-1.592
-1.69%
jan 1, 1998
91.346
-1.163
-1.26%
jan 1, 1999
94.396
+3.049
3.34%
jan 1, 2000
93.969
-0.427
-0.45%
jan 1, 2001
96.808
+2.84
3.02%
jan 1, 2002
94.804
-2.005
-2.07%
jan 1, 2003
96.502
+1.698
1.79%
jan 1, 2004
95.063
-1.439
-1.49%
jan 1, 2005
94.211
-0.851
-0.9%
jan 1, 2006
94.752
+0.541
0.57%
jan 1, 2007
94.584
-0.168
-0.18%
jan 1, 2008
94.611
+0.026
0.03%
jan 1, 2009
93.964
-0.647
-0.68%
jan 1, 2010
93.155
-0.809
-0.86%
jan 1, 2011
94.011
+0.855
0.92%
jan 1, 2012
91.118
-2.893
-3.08%
jan 1, 2013
94.849
+3.731
4.09%
jan 1, 2014
92.388
-2.461
-2.59%
Ranking of countries by current statistics by years


Comments: